|
ENGINEERING HYDROLOGY: 021
1. PRECIPITATION
1.01
Engineering hydrology takes a quantitative view of the hydrologic cycle.
1.02
Rainfall is the liquid form of precipitation.
1.03
The catchment has an abstractive capability that acts to reduce total rainfall into effective rainfall.
1.04
The difference between total and effective rainfall is the hydrologic abstractions.
1.05
Hydrologic abstractions include - interception,
- infiltration,
- surface storage,
- evaporation, and
- evapotranspiration.

1.06
The terms effective rainfall and runoff are equivalent.
1.07
Hydrologic mass balance equations use units of mm, cm, or inches, uniformly distributed over the entire catchment.
1.08
The Earth's atmosphere contains water vapor.

Clouds in the lower atmosphere.
1.09
The amount of vapor can be expressed as a depth of precipitable water.
1.10
The depth of precipitable water varies between 15 mm
in arid regions to 50 mm in humid regions.
1.11
The amount of water vapor contained in the air is a function of the temperature.
1.12
Lowering of the temperature reduces the amount of water vapor that the air can contain.
1.13
The rest is precipitated.
1.14
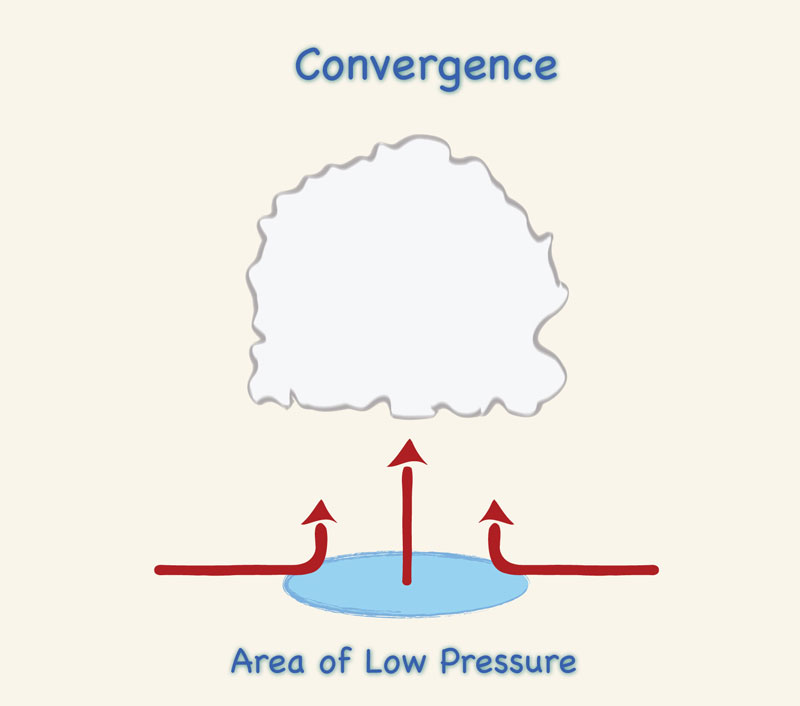
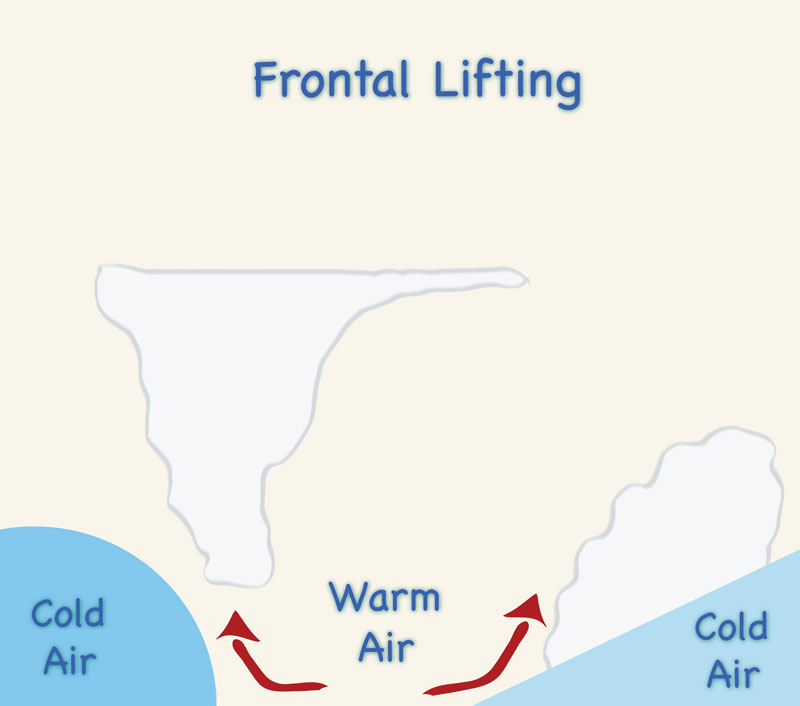
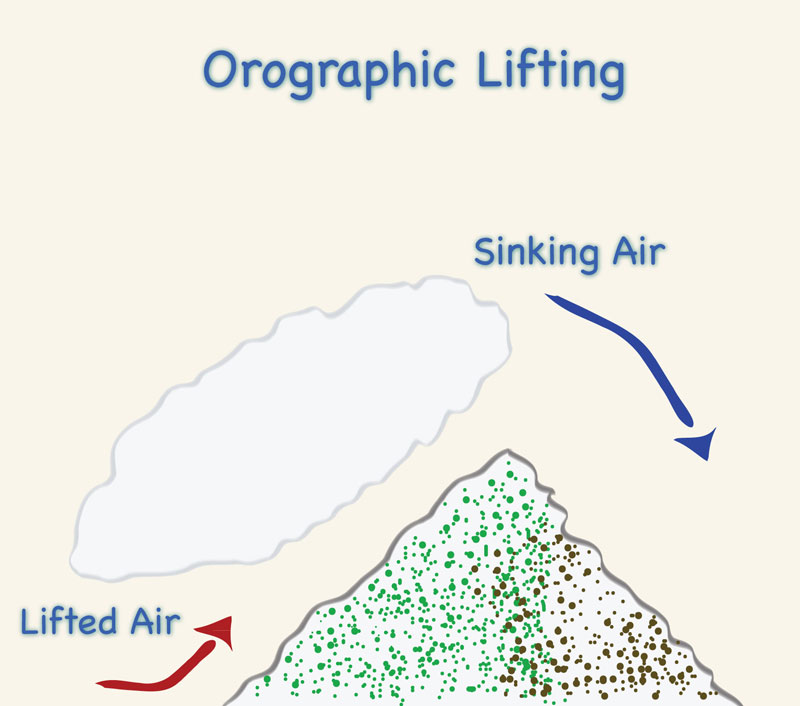
The cooling of air masses can be due to:
Convergence lifting: moist air masses move to low-pressure area, collide,
vapor raises, and cooling results.
Frontal lifting: warm moist air moves into colder air, which acts as a wedge;
warm air rises, and cooling results.
Orographic lifting: moist air flows toward an orographic barrier and is forced to rise,
resulting in its cooling.
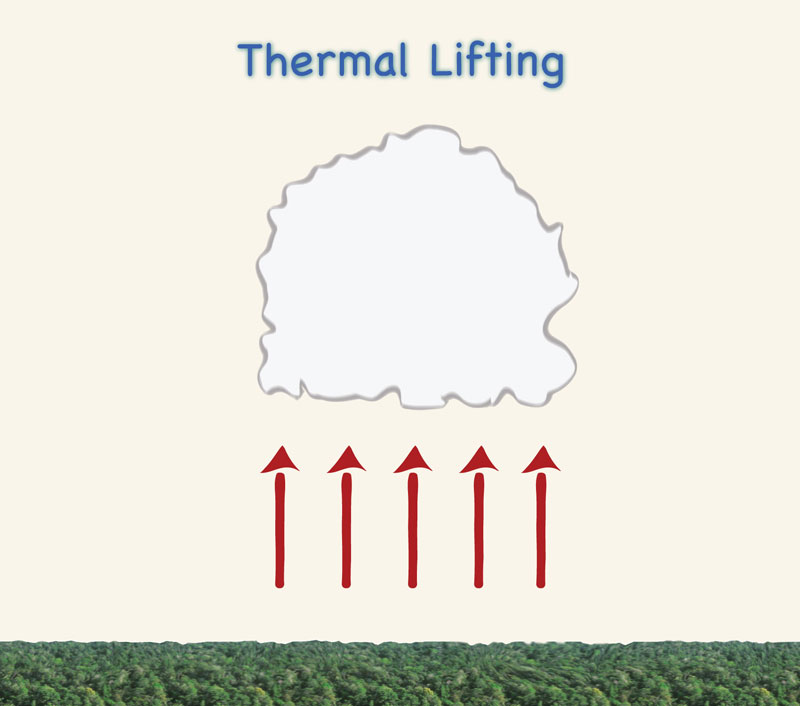
Thermal lifting: in regions with low albedo,
excess longwave radiation warms moist air near the ground and results in its lifting.
| Lifting mechanism | Description
|
| Convergence
| Air rises as it converges into a low-pressure area
|
| Frontal
| Air rises as it moves into a colder static air front
|
| Orographic
| Air rises as it moves over mountains
|
| Thermal
| Air rises as it is heated by radiation from the Earth's surface
|
1.15
The condensed water vapor must attain precipitation size in order to precipitate.
1.16
Air particles such as aerosols trigger coalescence of condensed water vapor into rain drops.
1.17
For rainfall to occur:
- there must be a sufficient amount of moisture,
- the moisture must cool to convert to liquid form, and
-
the liquid particles must coalesce and grow to attain precipitation size.
2. QUANTITATIVE DESCRIPTION OF RAINFALL
2.01
Rain consists of liquid-water drops, mostly larger than 0.5 mm in diameter.
2.02
Rainfall intensities can vary from light, less than 3 mm/hr, to heavy, more than 10 mm/hr.
2.03
Snow is ice crystals.
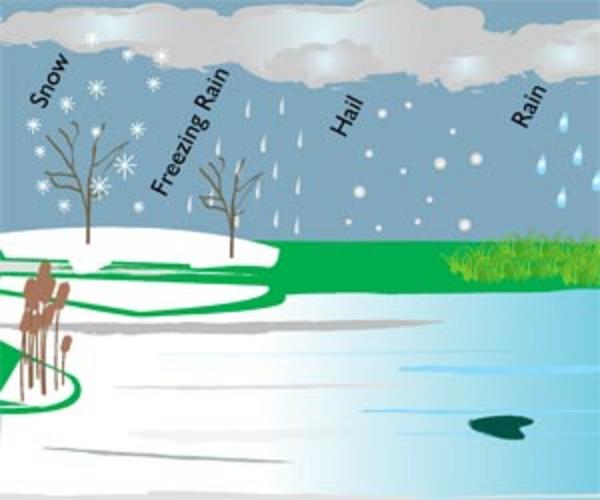
Types of precipitation (fondriest.com).
2.04
Hail is solid icestones, from 5 to 125 mm in diameter.
2.05
Hail is precipitation that is formed when thunderstorms carry raindrops upward into extremely cold areas of the atmosphere.
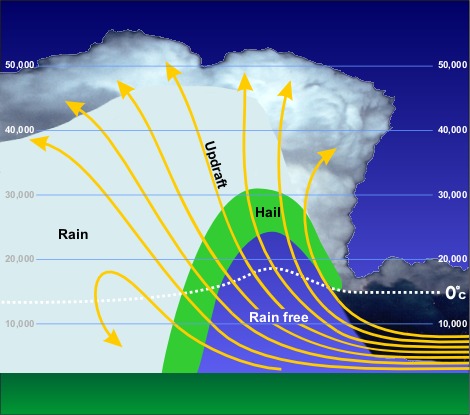
Formation of hail (National Weather Service).
2.06
Rainfall durations of 1, 2, 3, 6, 12, and 24 hr are common in engineering practice.
2.07
Storm depths can vary widely, depending on climate and season.
2.08
Larger depths occur more infrequently.
2.09
For example:
a 60 mm storm depth lasting 6 hr, that is, 10 mm/hr, may occur once every 10 yr.
2.10
This leads to the concept of intensity-duration-frequency, or IDF, which is particularly applicable to small catchments.
2.11
The return period is the reciprocal of the frequency; for instance, the frequency of
once in 50 yr, or 1/50, means a 50-year return period.
2.12
For long return periods, say, more than 100 years, there may not be enough data
to support statistical analysis.
2.13
When safety is an issue,
the deterministic concept of Probable Maximum Precipitation or PMP is used in lieu of frequency-based storms.
2.14
The PMP is used to develop the Probable Maximum Flood, or PMF.
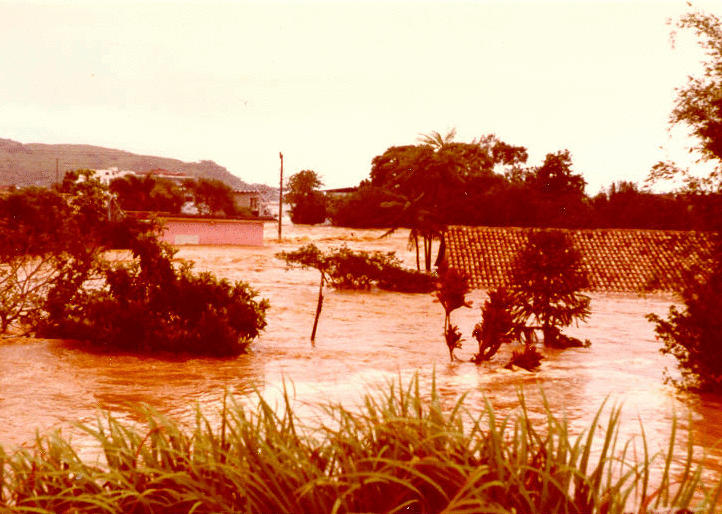
Extreme flooding in the Itajai valley, Santa Catarina, Brazil, January 1993.
2.15
In Corps of Engineers practice,
the Standard Project Flood or SPF is used.
2.16
The SPF is typically a fraction of the PMF.
3. RAINFALL DISTRIBUTIONS
3.01
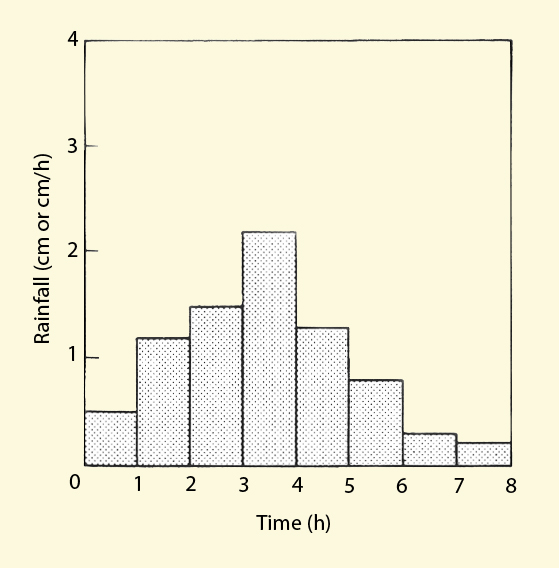
The variation of storm depth within the event duration is depicted by the temporal rainfall distribution.
3.02
The discrete form is the hyetograph.
<
3.03
The continuous form is the temporal rainfall distribution.
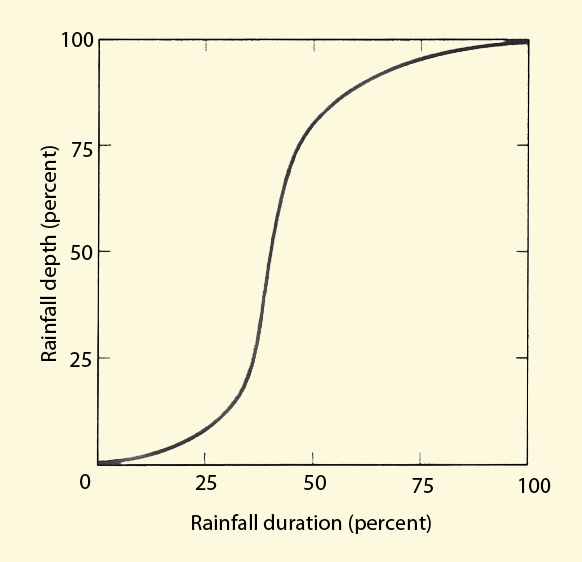
Rainfall hyetograph and dimensionless temporal rainfall distribution.
3.04
The temporal rainfall distribution can be expressed in dimensionless form.
3.05
A storm type is a dimensionless temporal rainfall distribution.
3.06
NRCS storm types I, IA, II, and III are in common use in the United States.
3.07
For midsize catchments, rainfall is specified as depth-duration-frequency, or DDF, and an applicable storm type.
3.08
The same amount of rainfall does not fall uniformly over the entire catchment.
3.09
Isohyetal curves depict the spatial variation of rainfall.
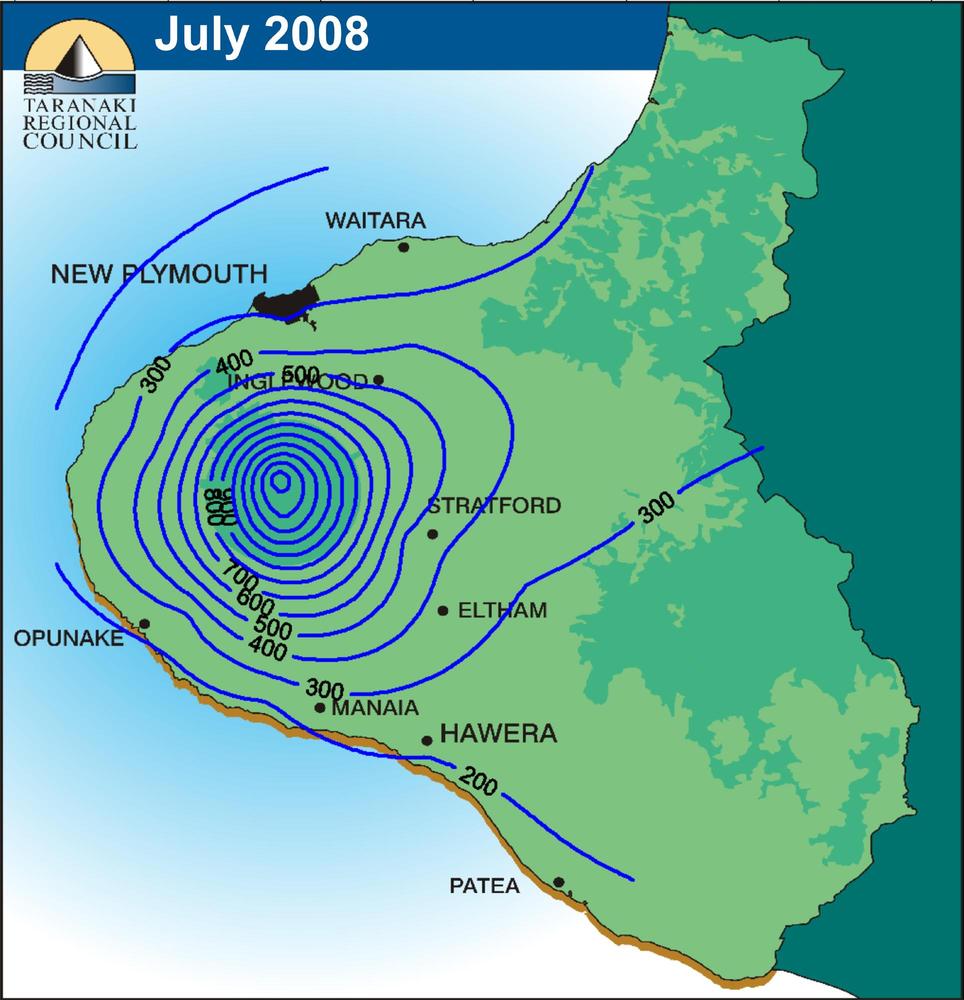
July 2008 isohyetal curves (mm) in the Taranaki region, New Zealand.
3.10
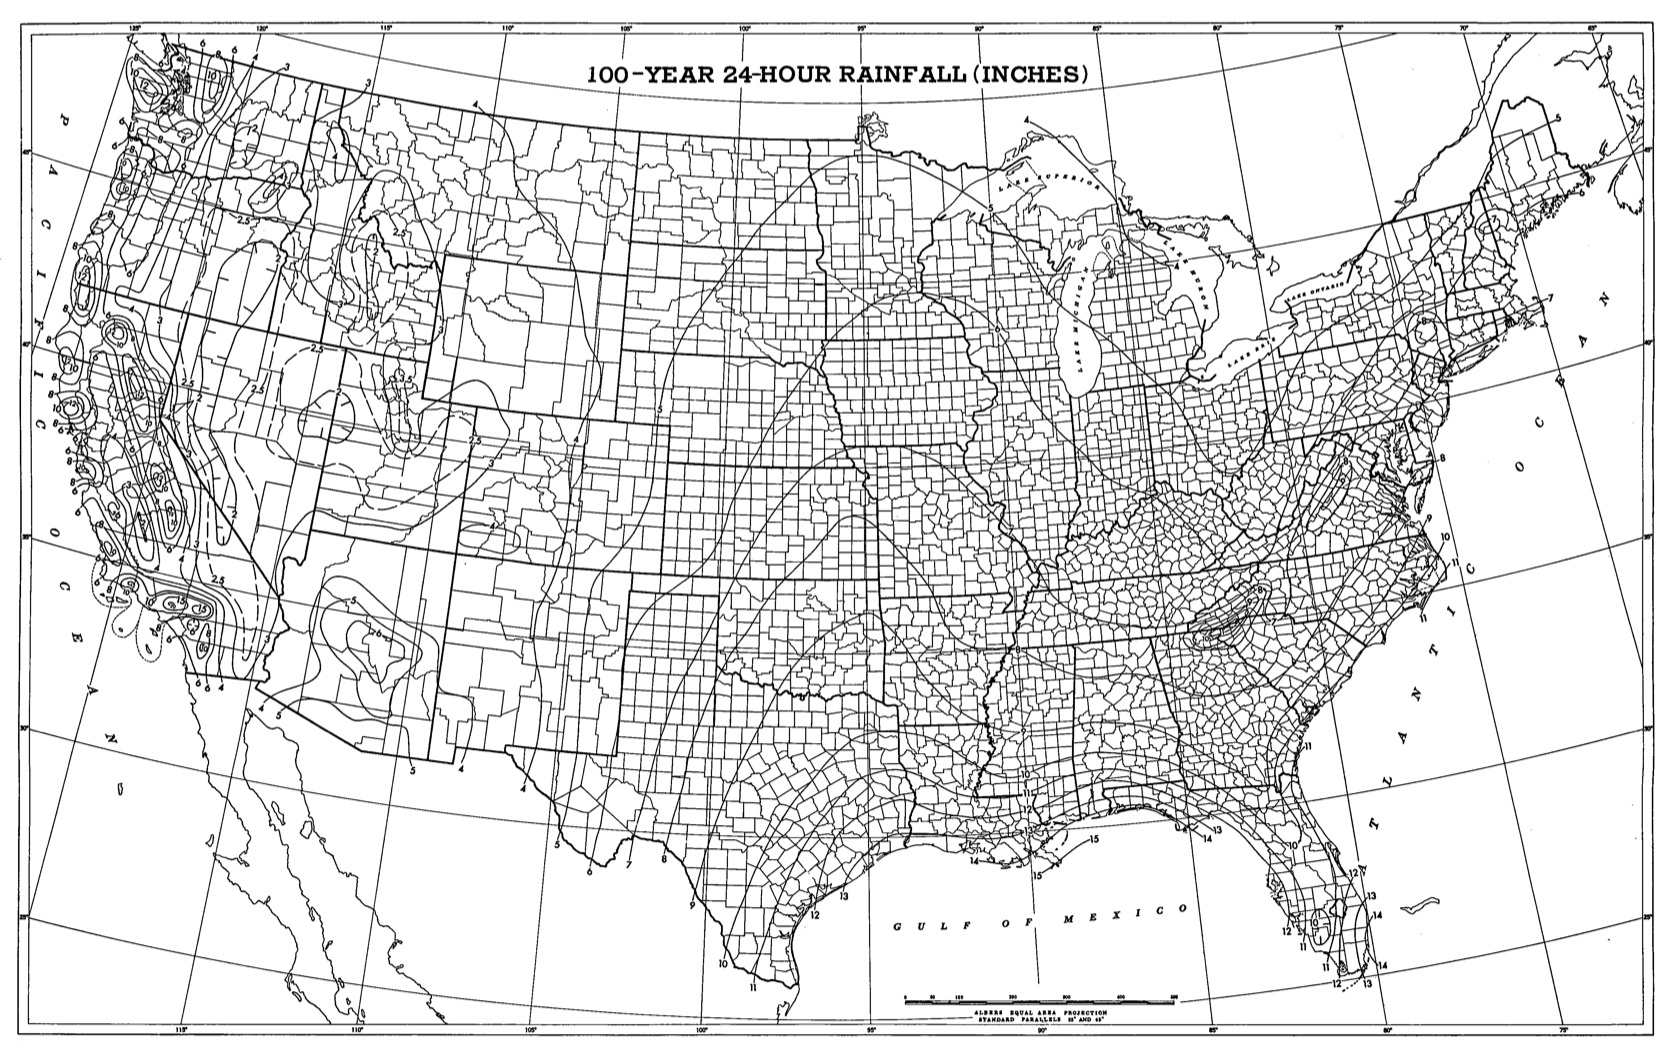
In regional rainfall maps, isohyetal curves or isohyets are referred to as isopluvials.
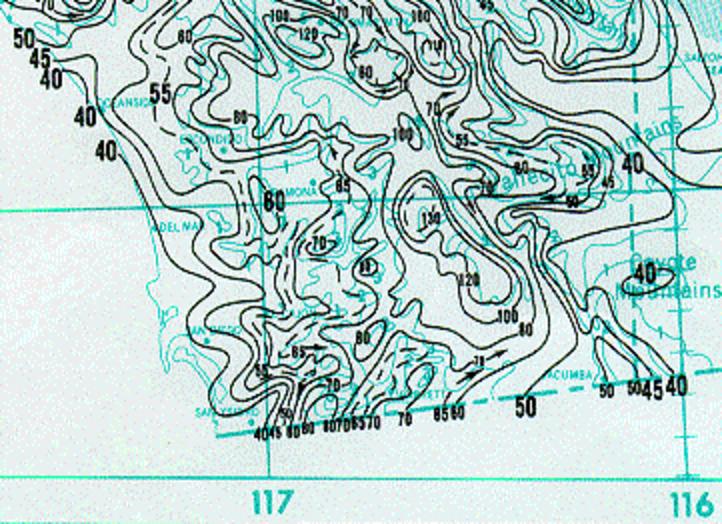
100-yr 24-hr isopluvials for San Diego, California, 0.1 in (Source: NOAA)
3.11
It is often necessary to determine a spatial average of precipitation.
3.12
This is performed in three ways:
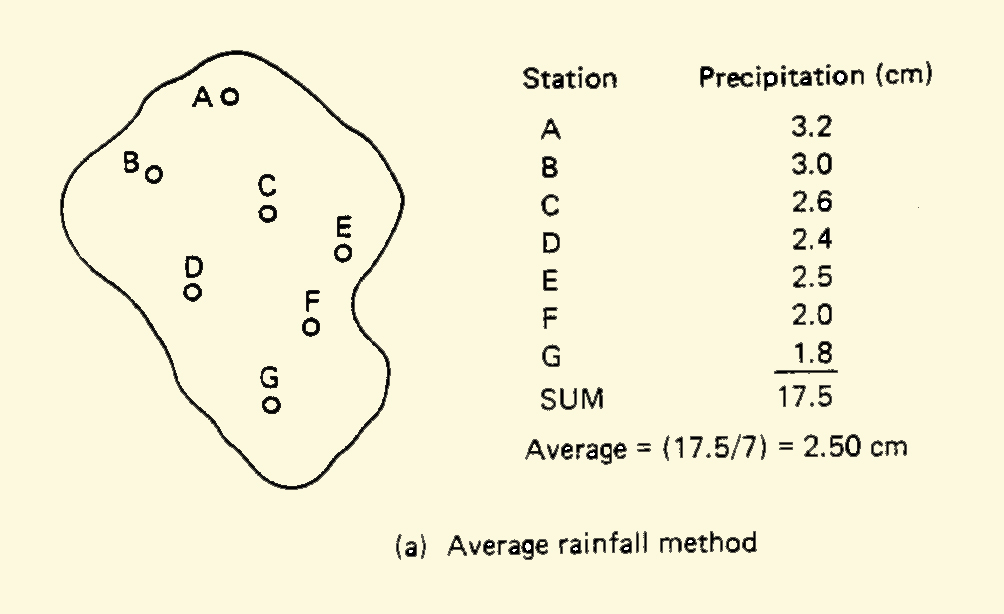
3.13
a. Average method: the raingage depths are averaged without regard to rainfall intensity or area of influence.
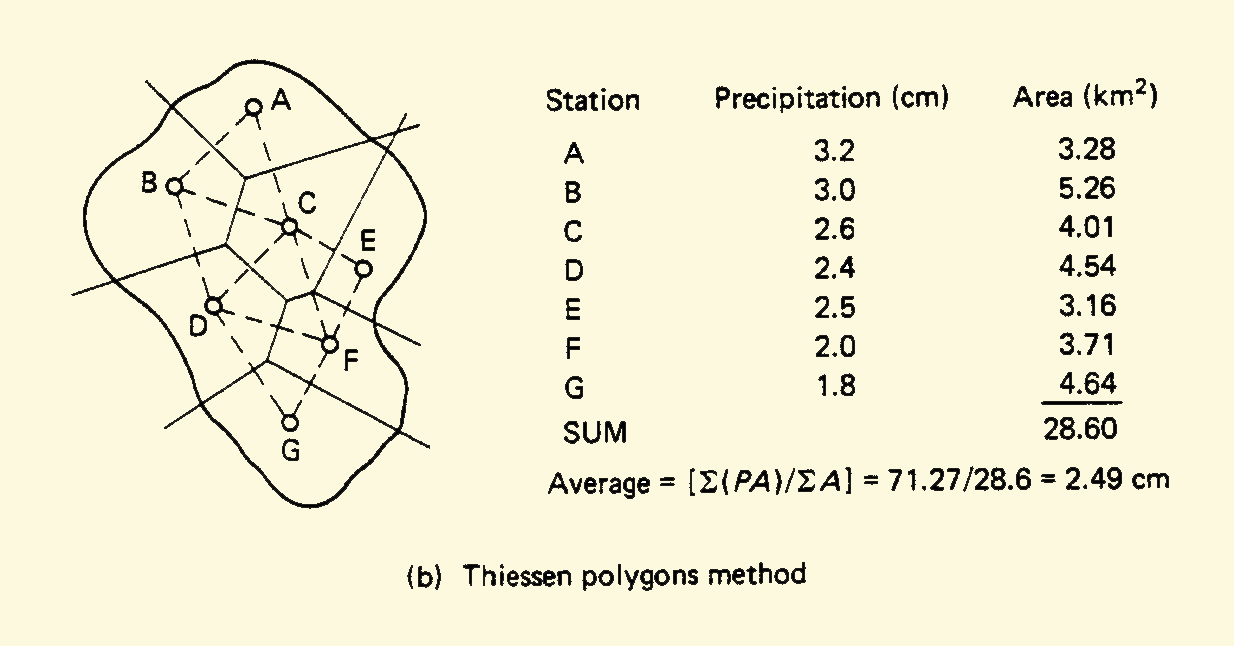
3.14
b. Thiessen polygons: the raingage locations are joined with straight lines, and perpendicular bisectors are drawn to determine the area of influence
of each raingage.
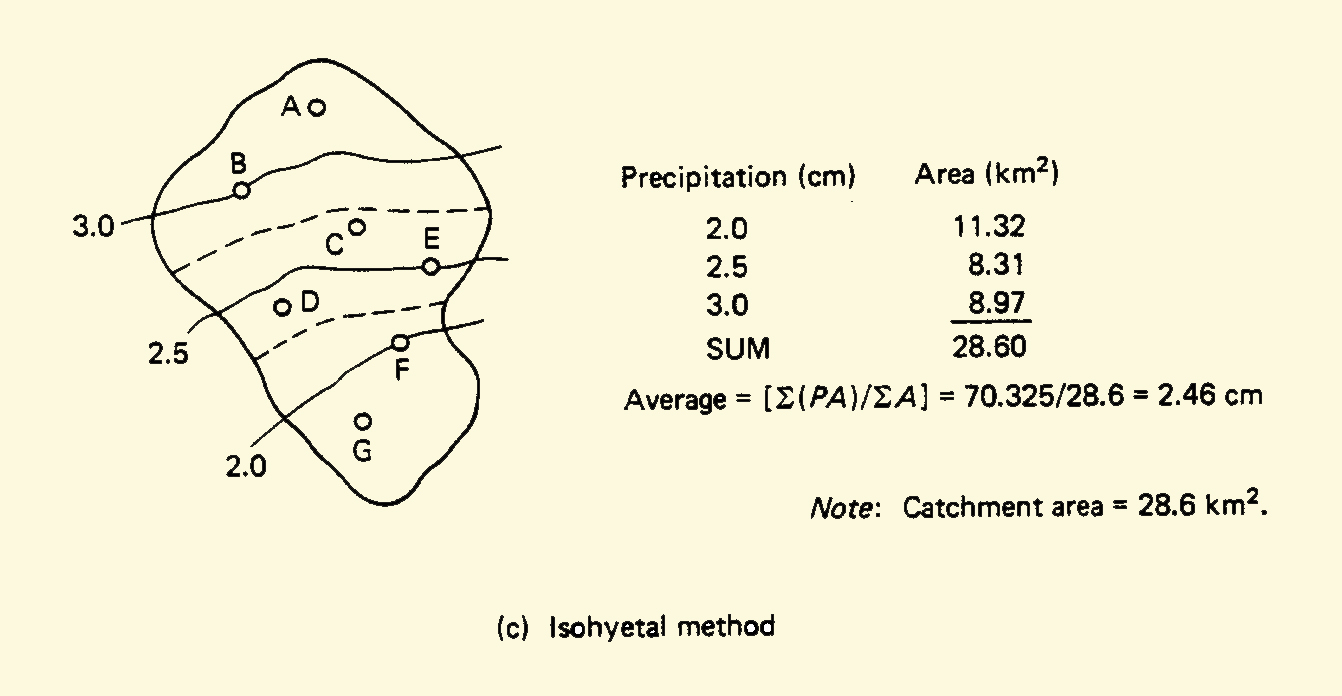
3.15
c. Isohyetal method: the raingage depths are used to draw contours of equal rainfall,
and the mid-distance between two adjacent isohyets
determines the area of influence of each isohyet.
4. STORM ANALYSIS
4.01
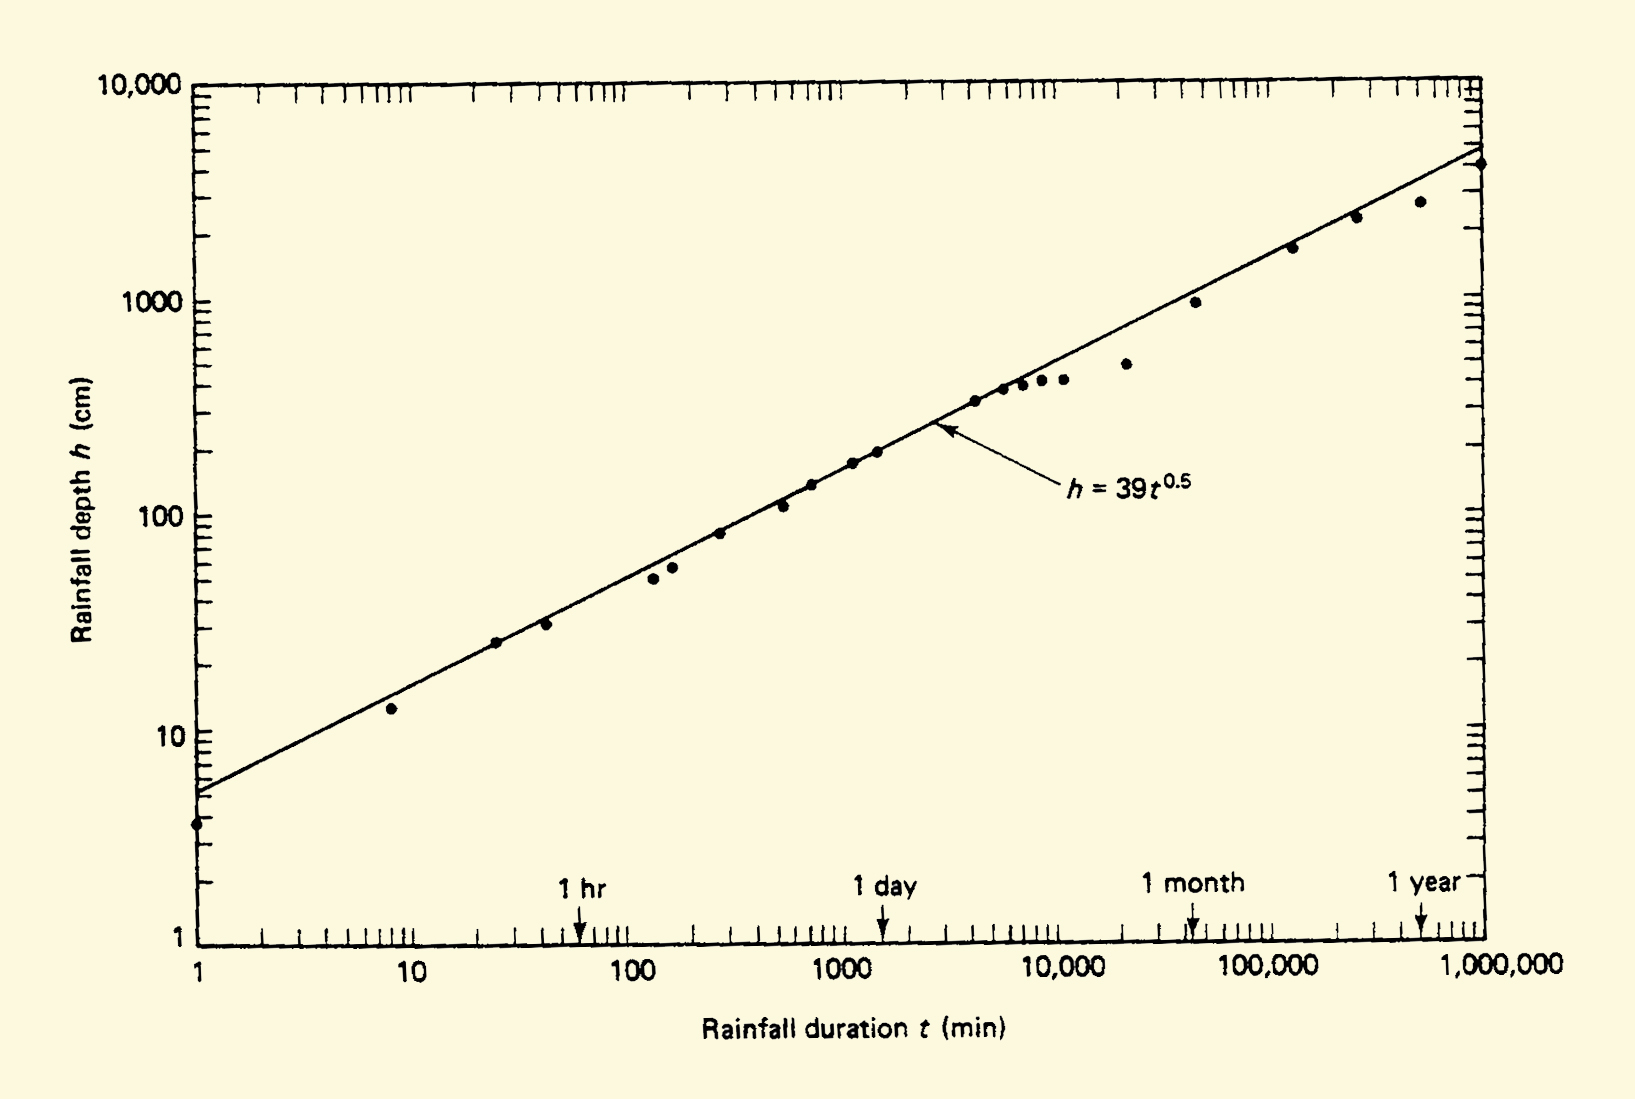
Storm depth h and duration t are directly related, that is, the longer the storm duration, the greater the storm depth.
 
4.02
In practice, the exponent n varies between 0.2 and 0.5.
4.03
The depth-duration data for the world's greatest observed rainfall events
is shown here.
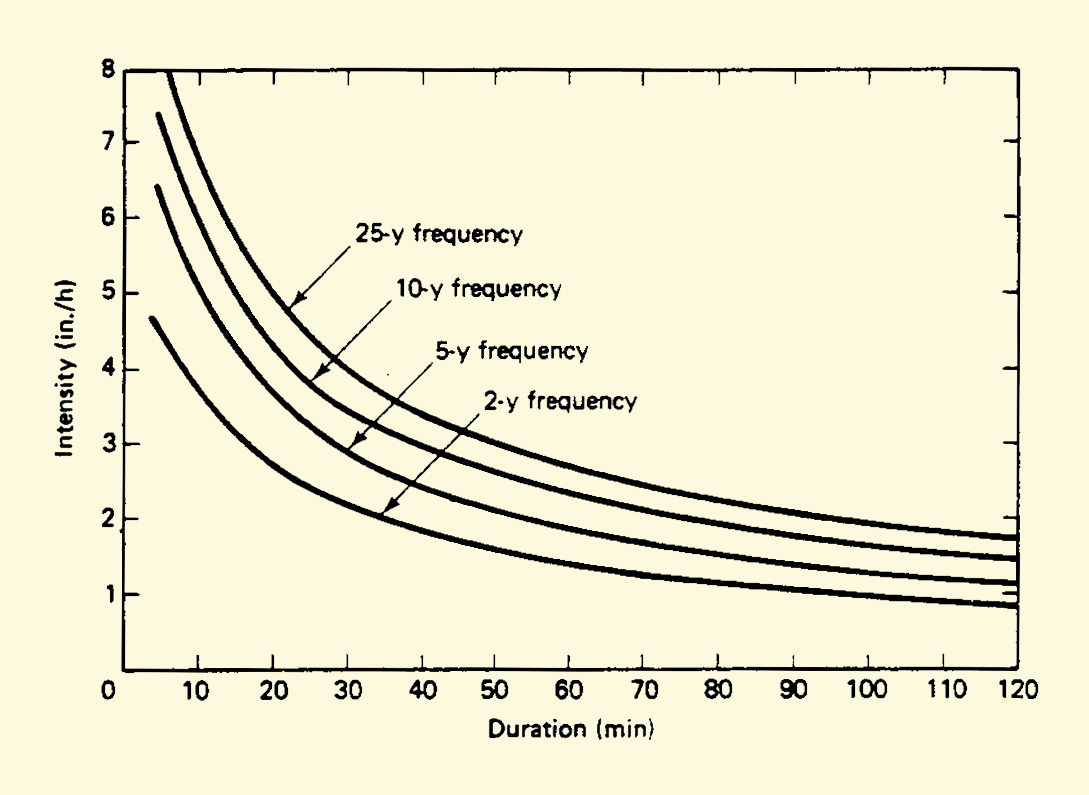
4.04
Differentiating rainfall depth with respect to duration gives rainfall intensity i:
4.05
Simplifying, replacing constants a = c n, and m = n - 1, we conclude that rainfall intensity and duration are inversely related.
4.06
A general intensity-duration model, where b is a constant, is:
4.07
A more general intensity-duration-frequency model, where T is the return period and K and n are constants, is:
Intensity-duration-frequency curves.
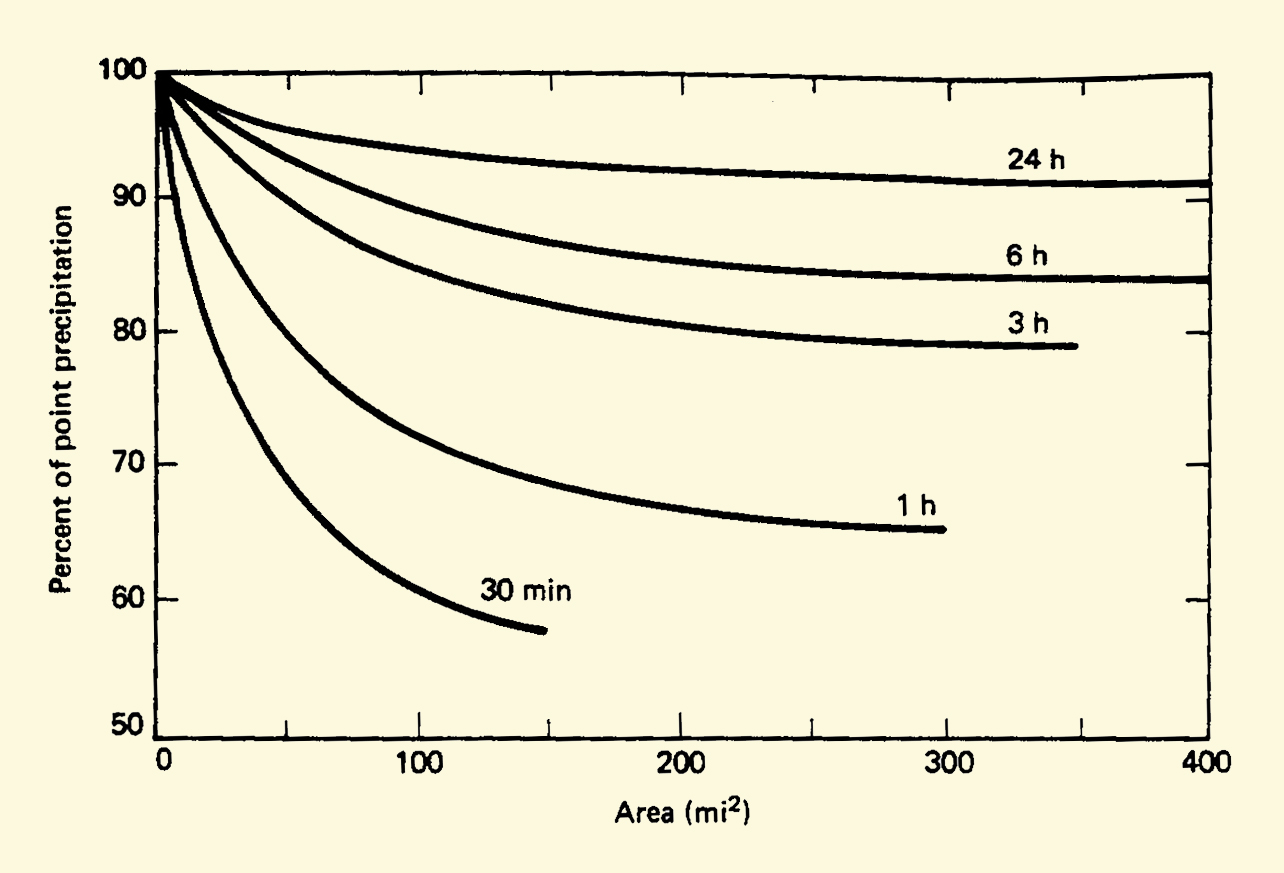
4.08
Generally, the greater the catchment, the smaller the spatially averaged storm depth.
4.09
The point depth is the storm depth associated with a point area.
4.10
Point area is the smallest area below which the variation of storm depth with catchment area is assumed to be negligible.
4.11
For large catchments, a reduction in average storm depth is warranted.
4.12
National Weather Service depth-area reduction charts are available.
National Weather Service depth-area reduction charts.
4.13
Isopluvial maps depicting storm depths for a range of durations up to 24 hours, and frequencies up to 100 years,
are available for the United States.
4.14
These maps show point-depth values.
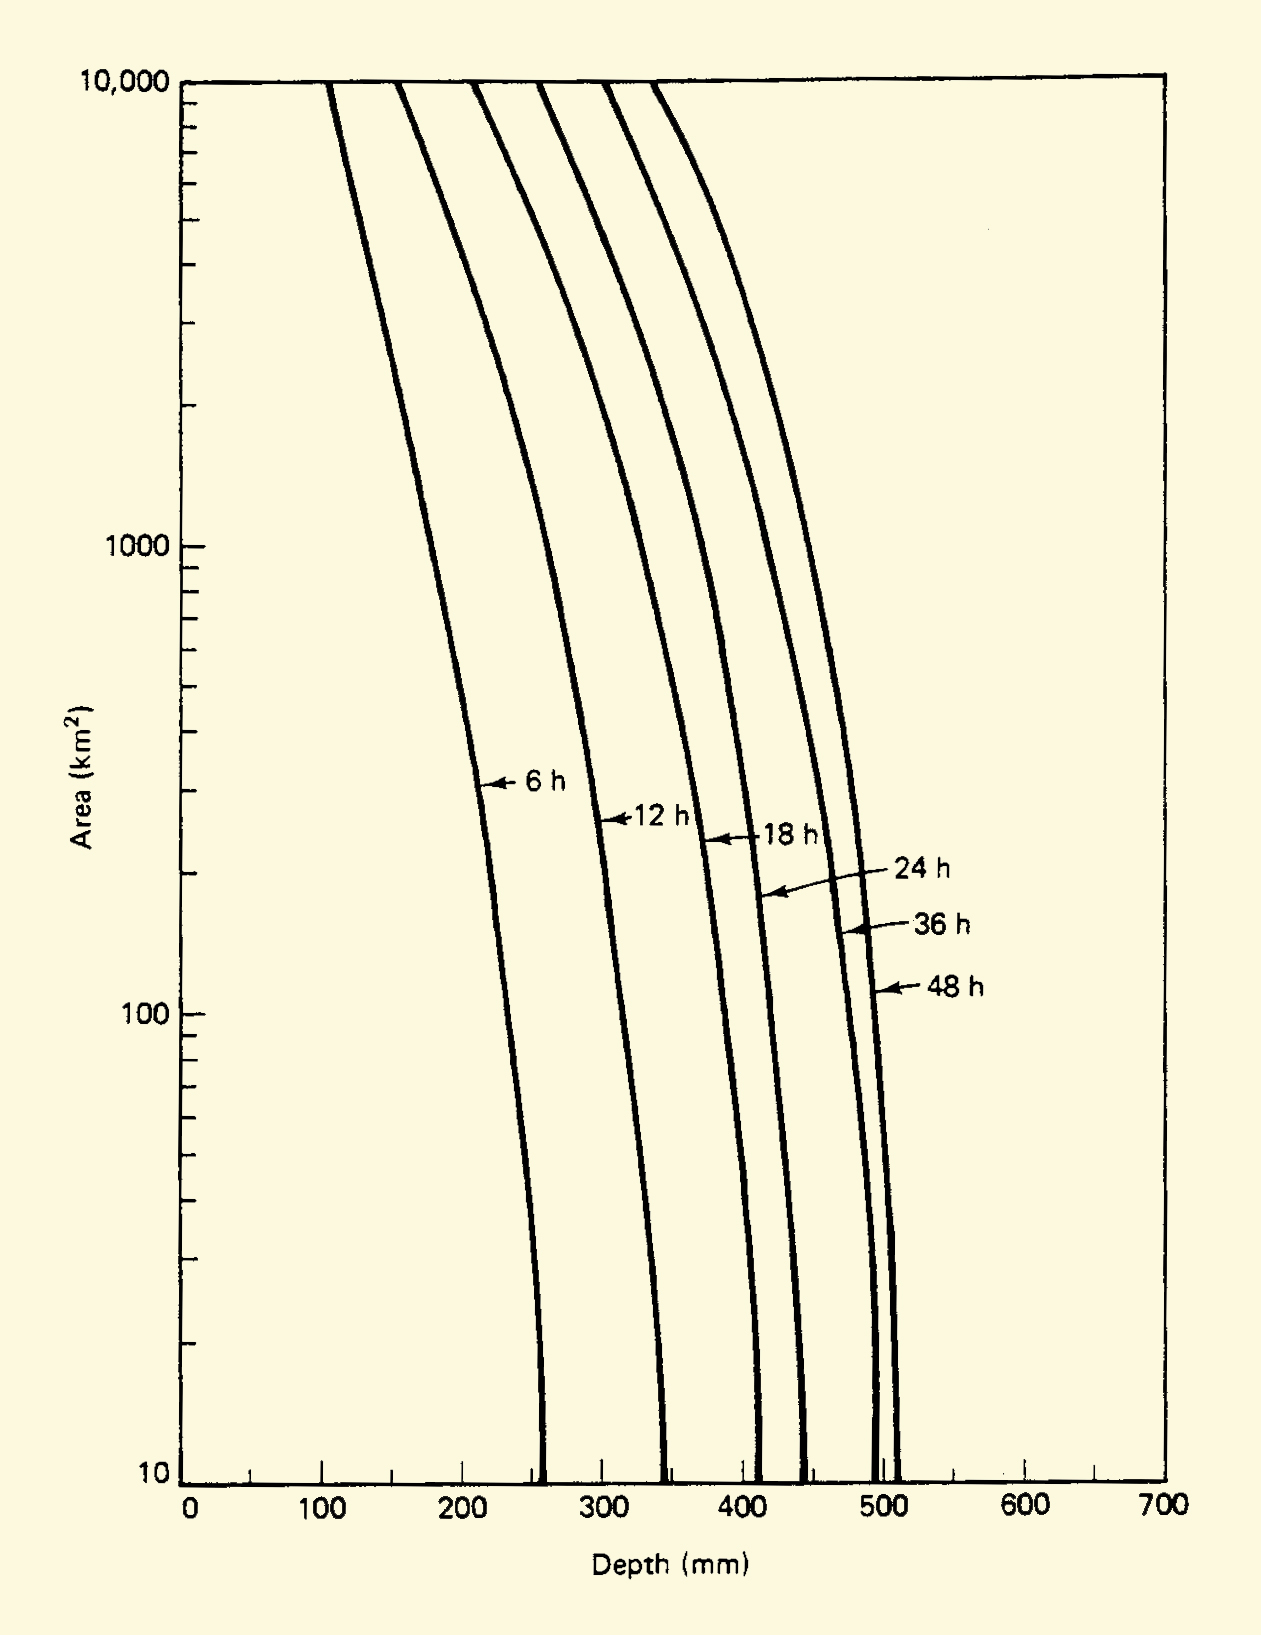
4.15
The reduction of storm depth with catchment area is portrayed by the
depth-area-duration chart, or DAD chart,
with storm duration as a third variable.
A depth-area-duration chart.
Narrator: Dr. Victor M. Ponce
Music: Fernando Oñate
Editor: Flor Pérez
Credits: Google
Copyright © 2010
Visualab Productions
All rights reserved
| 


