|
ENGINEERING HYDROLOGY: CHAPTER 025
1. A CATCHMENT
1.1
A catchment is an area of the Earth's surface that
collects surface runoff and delivers the flow to its lowest point, the outlet, or mouth.
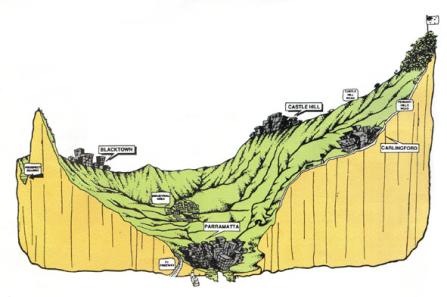
Upper Parramatta River Catchment, Australia.
1.2
Surface runoff occurs as a progression of the following forms:
* Overland flow
* Rill flow
* Gully flow ...
* Streamflow
* River flow ...
1.3
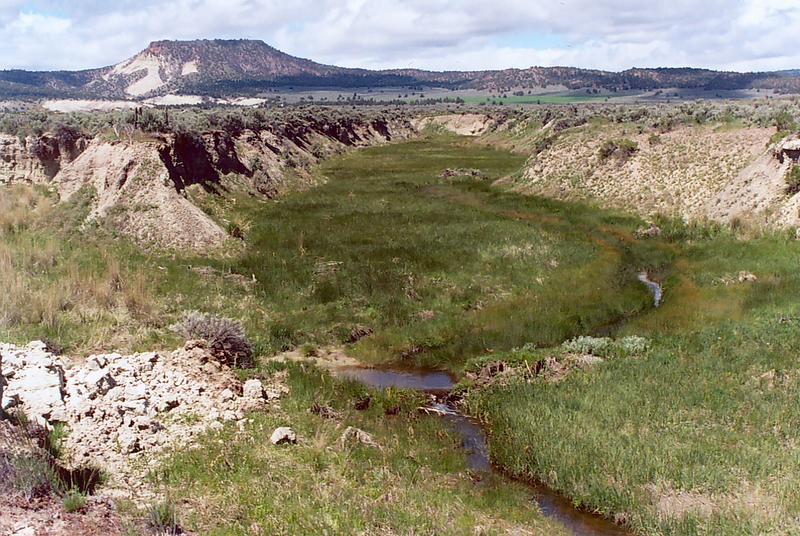
Large gully at Camp Creek, near Prineville, Oregon.
1.4
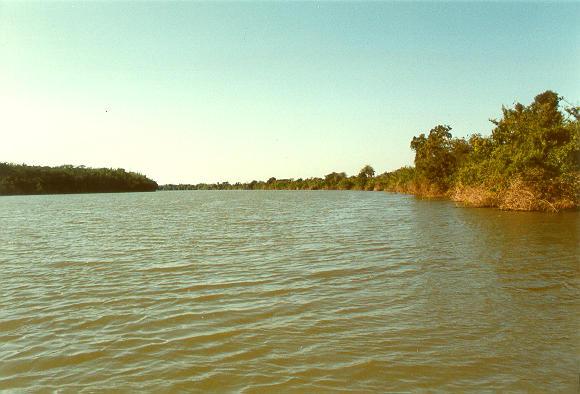
Apa river, on the border between Brazil and Paraguay.
1.5
A catchment can be as little as less than one hectare, and as large as
several million square kilometers.
1.6
The Amazon basin, the largest in the world, is about 7 million
square kilometers, accounting for about one-sixth of the world's fresh water.
1.7
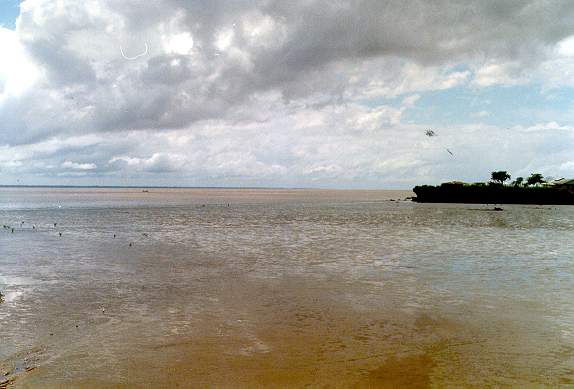
Mouth of the Amazon river basin, at Macapa, Brazil.
1.8
In small catchments, or watersheds, runoff is primarily controlled by overland flow processes.
1.9
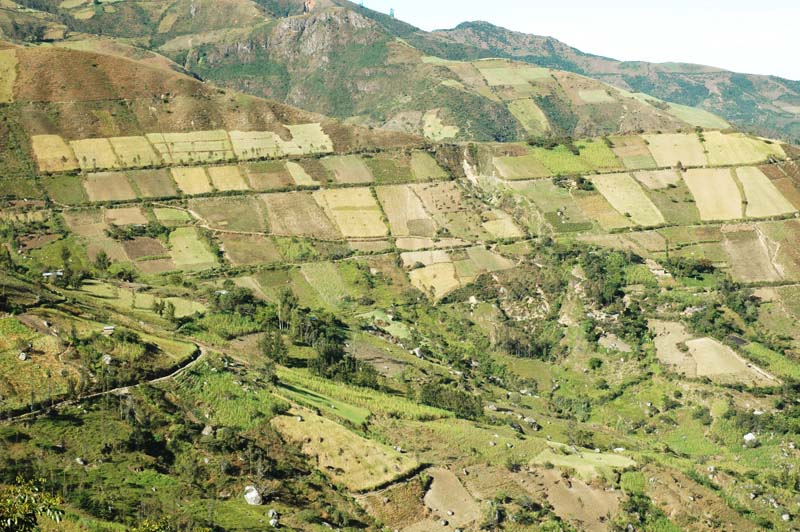
Overland flow in the Moyan watershed, Lambayeque, Peru.
1.10
Overland flow is the two-dimensional flow on planes.
1.11
Overland flow is governed primarily by flow convection, with very little diffusion.
1.12
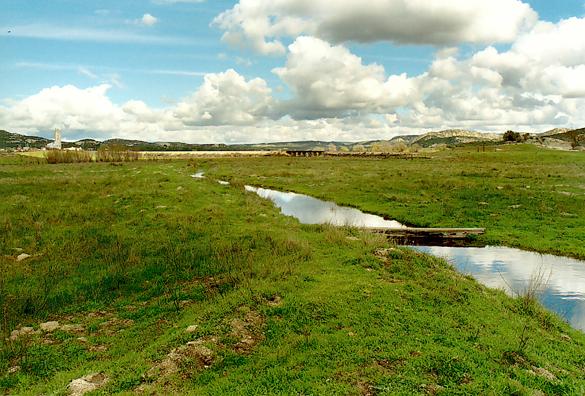
Campo Creek, San Diego County, California.
1.13
In large catchments, or river basins, runoff is primarily controlled by channel storage processes.
1.14
Channel storage is the one-dimensional process of runoff diffusion, that is, flow attenuation, while the flow
travels through the river channels.
1.15
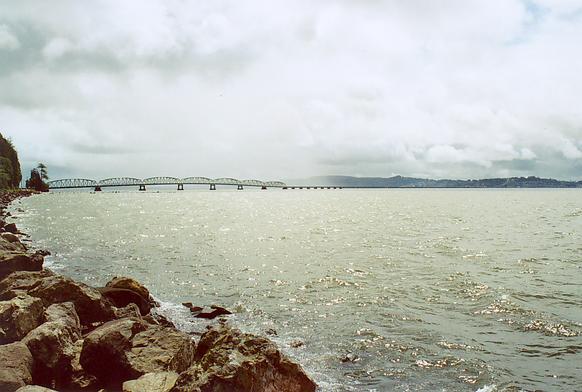
The Columbia river, between Oregon and Washington.
1.16
In midsize catchments, depending on size and prevailing slope,
runoff is controlled by both overland flow and channel storage.
1.17
The hydrologic characteristics of catchments are described in terms of the following properties:
* Drainage Area
* Catchment shape
* Catchment relief
* Linear measures
* Drainage density
* Drainage patterns
2. CATCHMENT AREA
2.1
Drainage area determines the potential runoff volume, provided the storm covers the entire area.
2.2
The larger the catchment, the less likely it is that a storm will cover the entire area.
2.3
The catchment divide follows the peaks and saddles of the topography.
2.4
The collection of peaks and saddles determines the physical location of the catchment divide.
2.5
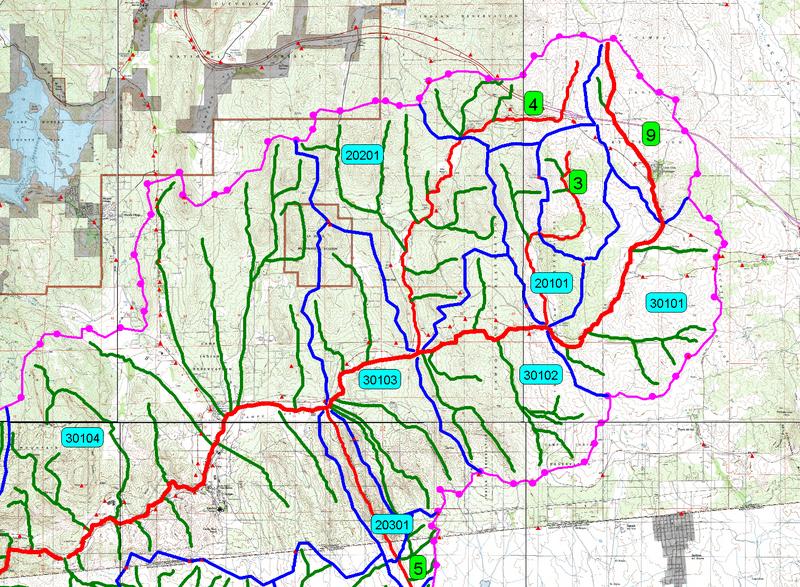
Campo Creek watershed, in Southeastern San Diego County, California,
showing collection of peaks and saddles (pink dots) delimiting the watershed.
2.6
Because of subsurface flow, the topographic divide may not coincide with the hydrologic divide.
2.7
In the absence of a detailed groundwater evaluation, the topographic divide is usually taken as the hydrologic divide.
2.8
Runoff originates at high points at or close to the topographic divide, and moves toward lower elevations in a direction generally perpendicular to the terrain's contour lines.
2.9
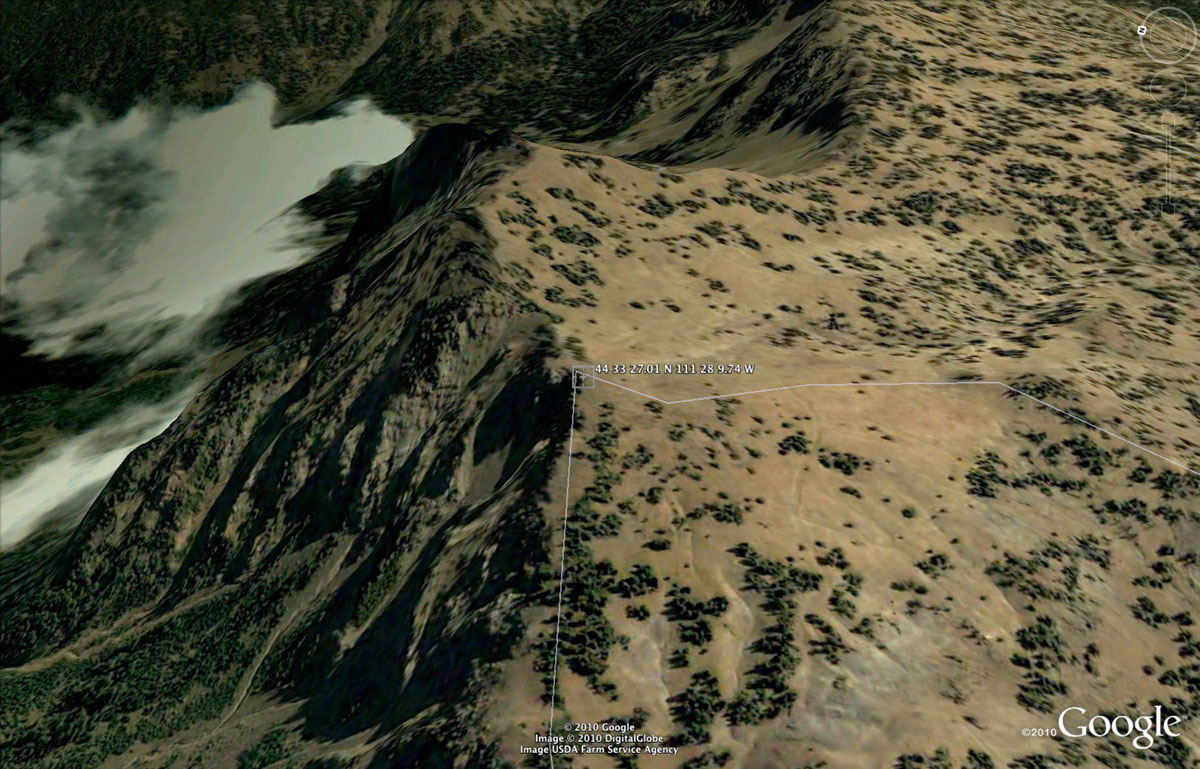
Source of the Missouri river, along the border between Montana and Idaho (Google Earth).
2.10
Several formulas have been proposed to relate peak flow to catchment area.
2.11
A basic formula is:
2.12
2.13
in which:
Qp = peak flow
A = catchment area
c and m = empirical constants.
2.14
The U.S. Geological Survey uses this formula in their regional regression equations for estimating flood peaks at ungaged sites.
2.15
For example, the 100-year flood peak for the State of California's Northeast Region is:
2.16
3. CATCHMENT SHAPE
3.1
Robert E. Horton (1875-1945) was a distinguished American engineer and scientist, considered by many to be the father of modern hydrology.
3.2
Horton described the outline of a normal catchment as a pear-shaped ovoid.
3.3
Large catchments, however, can vary widely in shape.
3.4
A form ratio based on catchment area is defined as follows:
3.5
3.6
in which:
Kf = dimensionless form ratio
A = catchment area
L = catchment length, measured along the longest watercourse.
3.7
The compactness ratio is based on the catchment perimeter.
3.8
An equivalent circle of area equal to that of the catchment is defined.
3.9
The perimeter of this equivalent circle is calculated.
3.10
The compactness ratio is the ratio of the catchment's perimeter to that of the equivalent circle.
3.11
3.12
in which:
Kc = compactness ratio
Pc = catchment perimeter
Ac = catchment area.
3.13
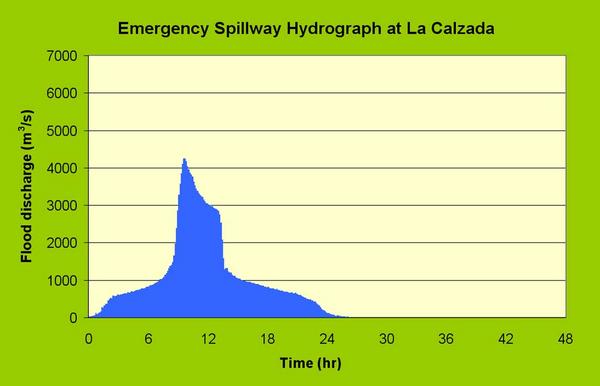
A high form ratio or a compactness ratio close to one describes a catchment having a fast and peaked catchment response.
3.14
Catchment response refers to the relative concentration and timing of runoff.
3.15
3.16
A faster response leads to higher peak flows.
3.17
Conversely, a slower response leads to lower peak flows.
3.18
Other factors such as relief, vegetative cover, and drainage density are usually more important
than shape in determining catchment response.
3.18
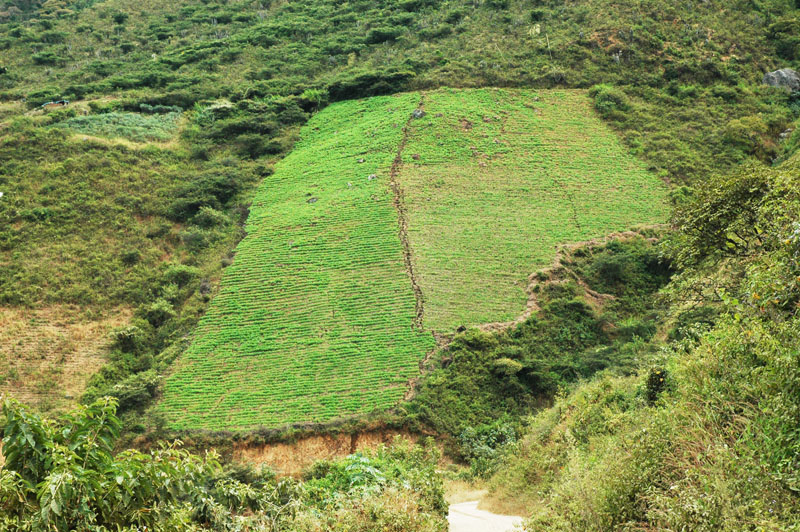
A diverse mix of land use on the steep hills of the Moyan River, Lambayeque, Peru.
4. CATCHMENT RELIEF
4.1
Maximum catchment relief is the elevation difference between the highest point
on the catchment divide and the lowest point at the catchment outlet.
4.2
The principal watercourse is usually the largest watercourse, and the one conveying the flow to the outlet.
4.3
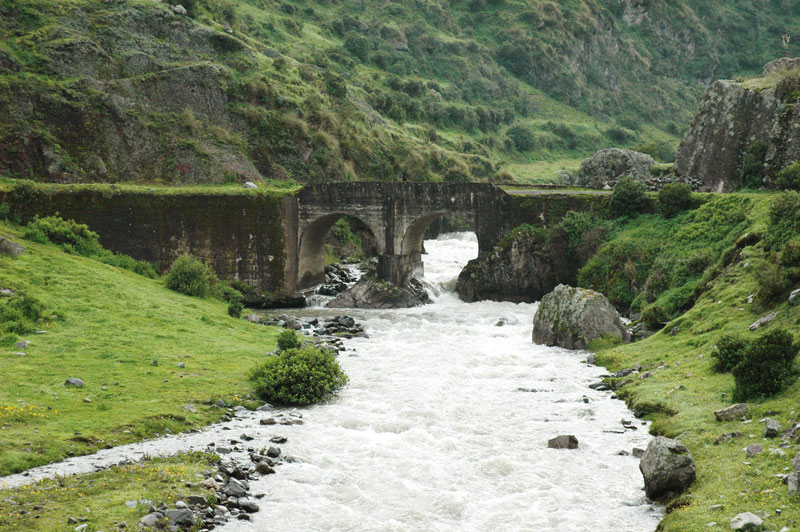
Santa Eulalia river, Lima, Peru.
4.4
Relief ratio is the ratio between maximum catchment relief and the longest horizontal distance measured along the principal watercourse.
4.5
The relief ratio is a measure of the intensity of erosional processes, or geodynamics.
4.6
Catchment relief is quantitatively described with a hypsometric curve.
4.7
A hypsometric curve is a dimensionless plot portraying the variation of surface area with elevation.
4.8
To develop a hypsometric curve, several elevations are selected within the range of possible elevations,
and partial areas above these elevations are calculated.
4.9
Elevations relative to the minimum elevation are expressed in percent of the maximum elevation difference.
4.10
Partial areas are expressed in percent of total catchment area.
4.11
Percent elevations are plotted vs percent partial areas to obtain the hypsometric curve.
4.12
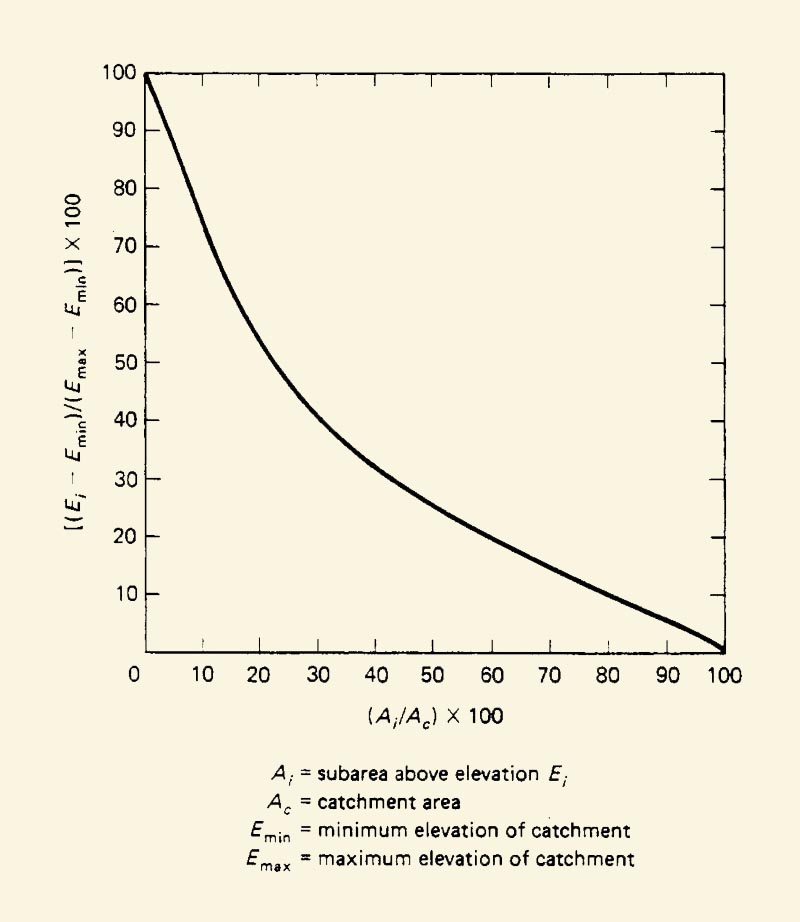
A catchment's hypsometric curve.
4.13
The longitudinal profile of a stream or river is a plot of streambed elevation vs horizontal distance.
4.14
In the absence of geologic controls, longitudinal profiles are usually concave when viewed from above.
4.15
A convex streambed profile is an indication of the presence of geologic controls, that is, rock outcroppings.
4.16
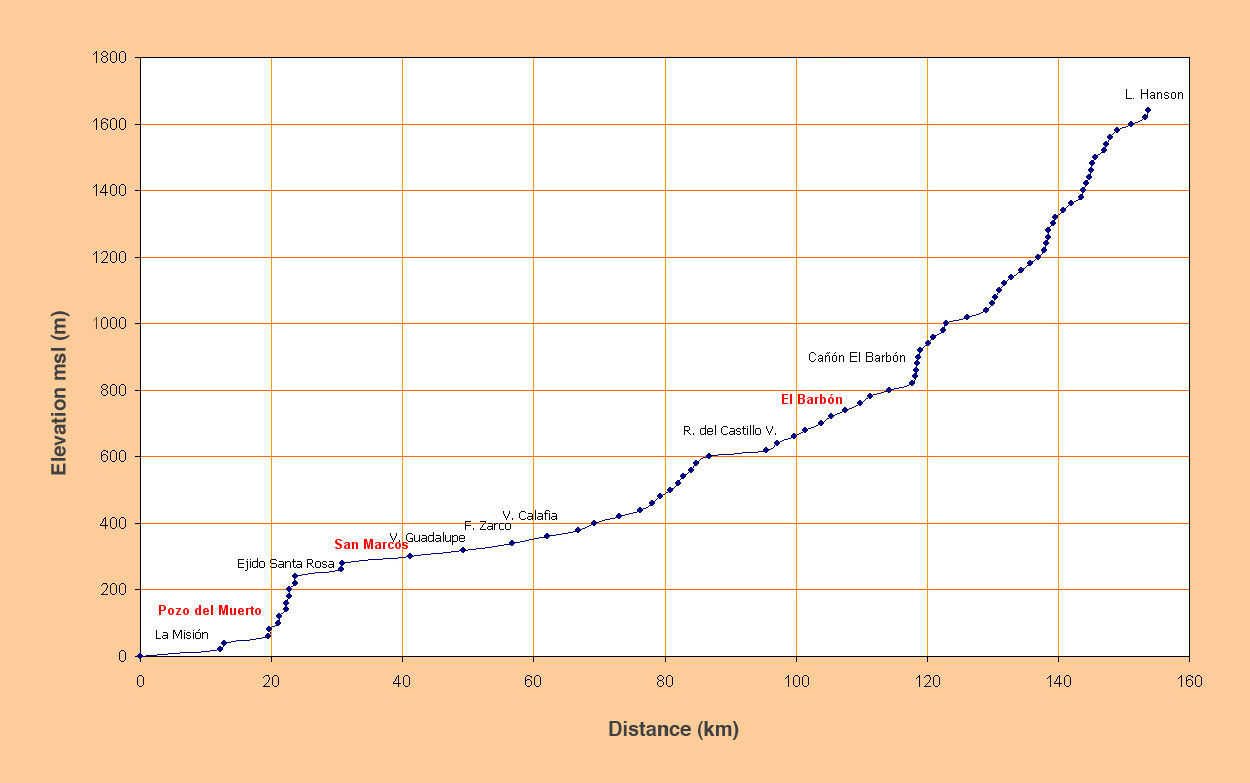
Streambed profile, Guadalupe Wash, Baja California, Mexico.
4.17
Channel gradients are directly related to bottom friction and inversely related to flow depth.
4.18
Typically, bottom friction increases and flow depth decreases in the upstream direction.
4.19
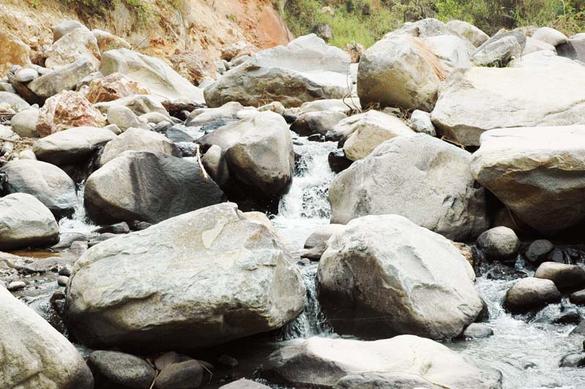
Rachichuela Wash, La Leche river watershed, Lambayeque, Peru.
4.20
Conversely, friction decreases and flow depth increases in the downstream direction.
4.21
Channel gradients vary widely, from steeper than 0.1 in typical mountain streams, to as mild as 0.000006 in some estuarial rivers.
4.22
The S1 slope is the channel gradient obtained directly from the maximum and minimum elevations, and the associated distance between them.
4.23
The S2 slope is the constant slope that makes the shaded area A1 above it equal to the shaded area A2 below it.
4.24
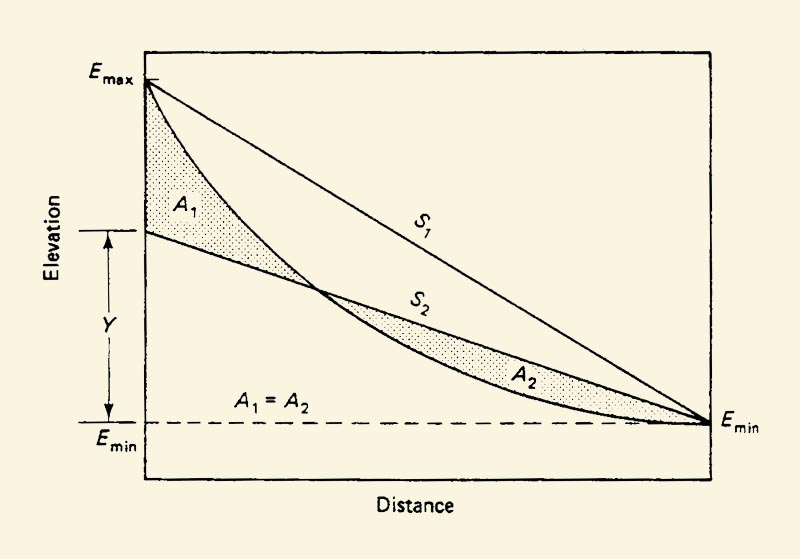
Sketch of S1 and S2 slopes.
4.25
An expedient way to calculate the S2 slope is to equate the total area below it to the total area below the longitudinal profile, that is: A1 = A2
4.26
The equivalent slope S3 takes into account the basin response time.
4.27
The channel is divided into n subreaches each of length Li, and a slope Si is calculated for each subreach.
4.28
The time of travel t through each subreach is equal to its length L over its velocity V, that is, it is directly proportional to its length and inversely proportional to the square root of its slope.
4.29
4.30
4.31
The sum of time of travel for all subreaches leads to the equivalent slope S3:
4.32
4.33
The U.S. Geological Survey's regional regression equations compute channel slope between two points located at 10% and 85% of the channel, measured in the upstream direction.
4.34
The USDA Natural Resources Conservation Service determines average surface slope by overlying a square grid pattern over a topographic map of the watershed.
4.35
The maximum slope at each intersection is evaluated, and the average of all values determined.
4.36
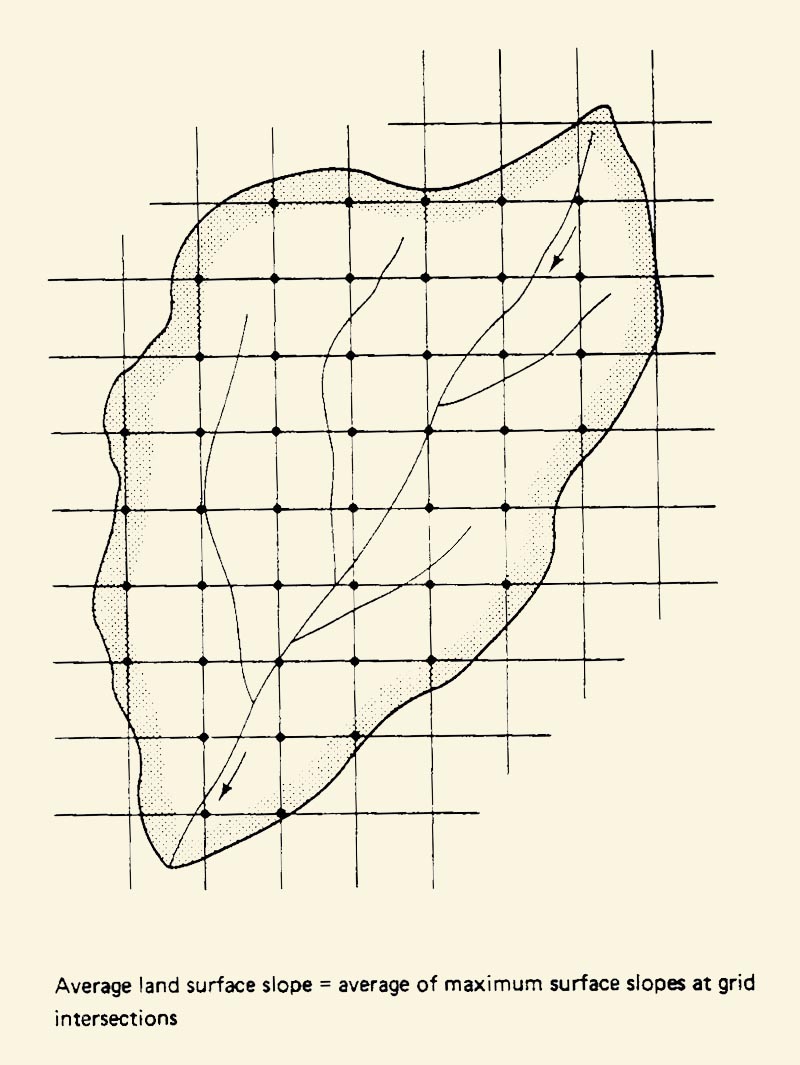
Square grid overlay to determine average surface slope.
5. LINEAR MEASURES
5.1
The catchment length, or hydraulic length, is the length measured along the principal watercourse.
5.2
The length to catchment centroid is the length measured along the principal watercourse, from the catchment outlet to a point located closest to the catchment centroid.
5.3
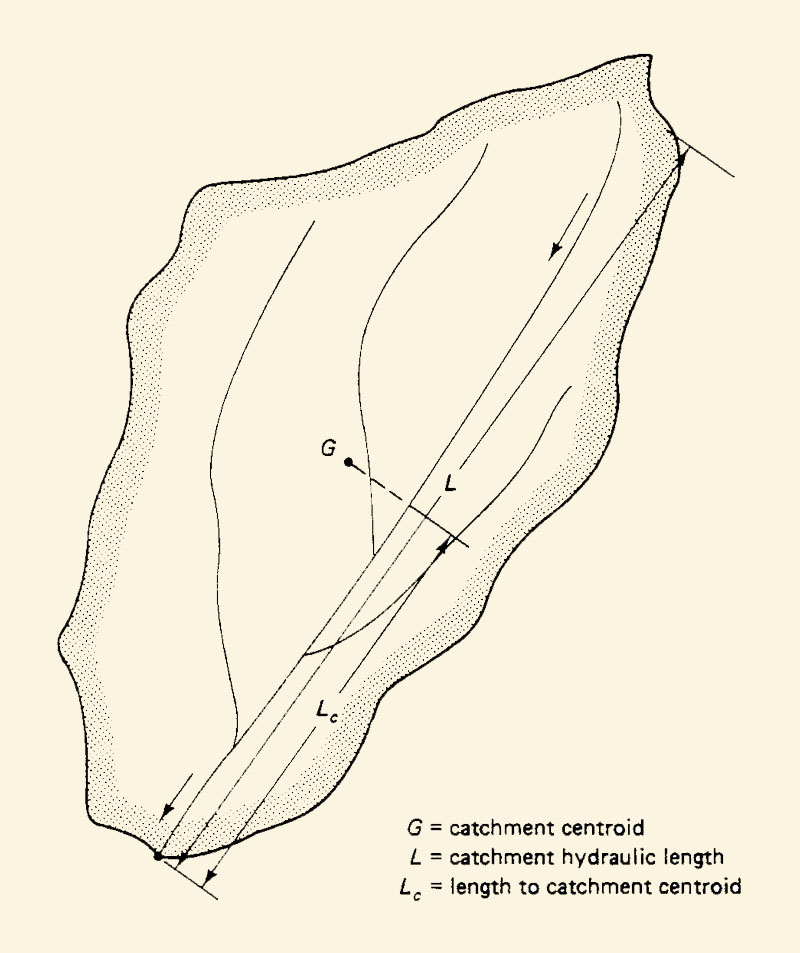
Linear measures of a catchment.
5.4
Stream order is essential to the hierarchical description of streams.
5.5
Overland flow is of hypothetical zero order.
5.6
A first-order stream receives overland flow.
5.7
Two first-order streams combine to form a second-order stream.
5.8
The catchment's stream order is the order of the main stream at its mouth.
5.9
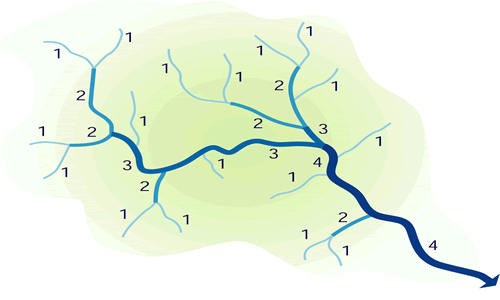
Concept of stream order.
6. DRAINAGE DENSITY
6.1
The drainage density of a catchment is the ratio of total stream length to catchment area.
6.2
Total stream length is the sum of all individual stream lengths.
6.3
Overland flow length Lois the mid-distance between stream channels.
6.4
Drainage density D is approximated by the following relation:
6.5
6.6
Thus, mean overland flow length Lo can be estimated as one-half of the reciprocal of drainage density.
6.7
7. DRAINAGE PATTERNS
7.1
Basin drainage patterns vary widely.
7.2
Various types of drainage patterns are shown here.
7.3
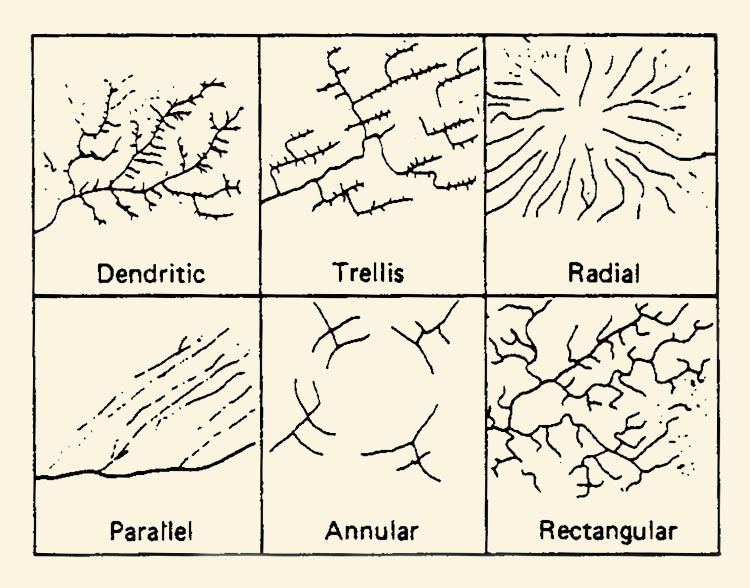
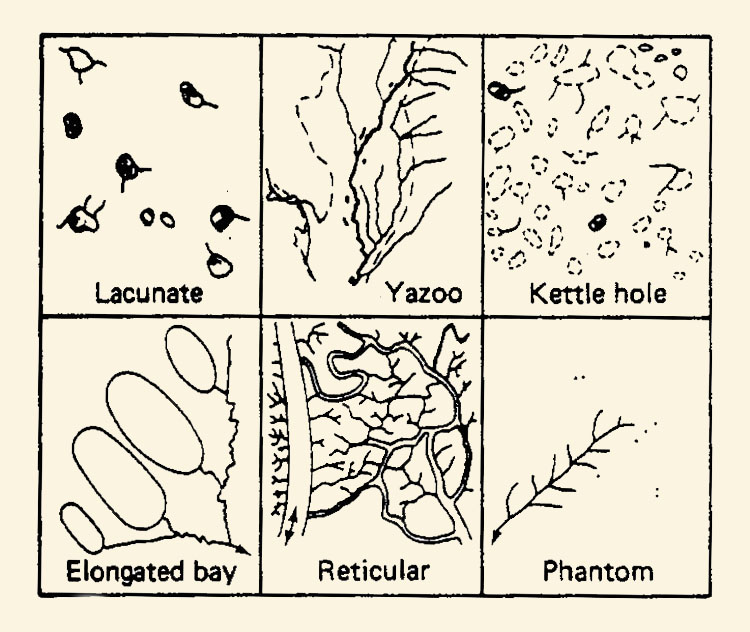
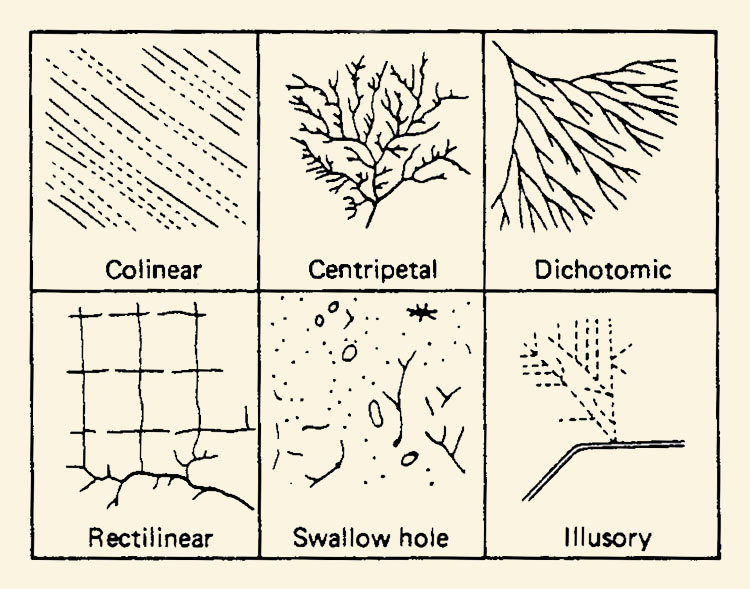
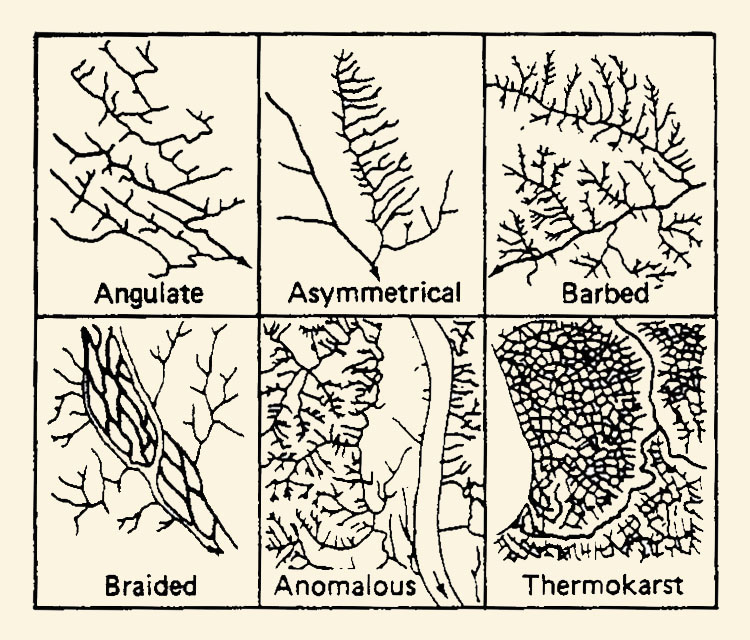
Basin drainage patterns.
7.4
These drainage patterns reflect the local geology and geomorphology and, secondarily, the influence of soil and vegetation.
7.5
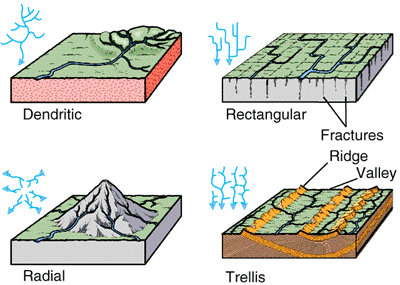
Drainage patterns based on geology and geomorphology.
7.6
Drainage patterns are related to hydrologic properties such as catchment response or annual water yield.
Narrator: Victor M. Ponce
Music: Fernando Oñate
Editor: Flor Pérez
Image Credits: Google
Copyright © 2010
Visualab Productions
All rights reserved
| 


