|
ENGINEERING HYDROLOGY: CHAPTER 026
1. RUNOFF
1.01
Surface runoff, or simply runoff, refers to all waters flowing on the surface of the earth, in the form of:
* Overland flow
* Rill flow
* Gully flow
* Streamflow
* River flow
1.02
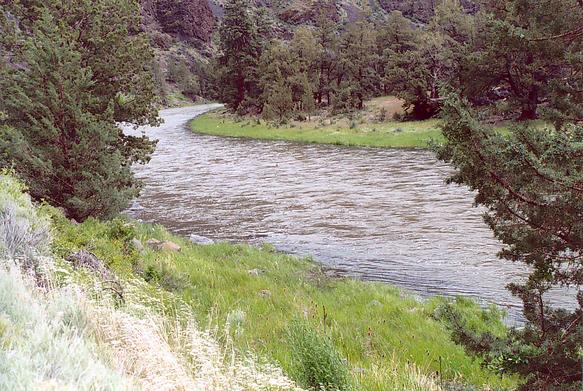
The Crooked river, Oregon.
1.03
Runoff is expressed in terms of flow rate or volume.
1.04
The local flow rate can be integrated over a period of time to give the accumulated runoff volume.
1.05
Runoff is also expressed in depth units, that is, the runoff volume spread uniformly over the catchment area.
1.06
In flood hydrology, runoff is sometimes expressed as peak flow per unit drainage area.
1.07
Runoff originates in three sources:
1. surface,
2. interflow,
3. groundwater.
1.08
Surface flow is also called direct runoff.
1.09
Direct runoff can produce large flow concentrations in a relatively short period.
1.10
Thus, direct runoff is responsible for floods.
1.11
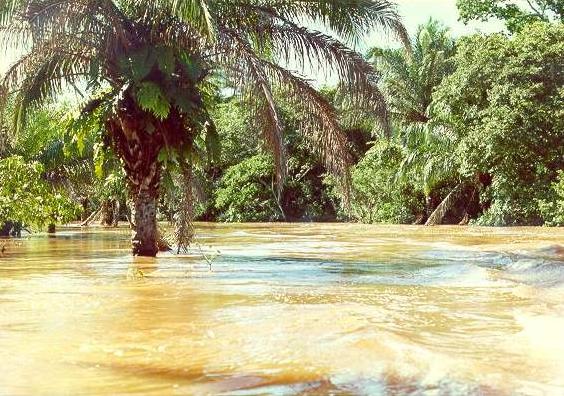
Flood on the Chane river, Eastern Bolivia.
1.12
Interflow is mostly the vertical movement of water in the unsaturated portion of the soil profile, referred to as the vadose zone.
1.13
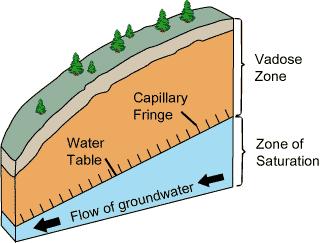
The vadose zone.
1.14
Groundwater flow takes place below the water table.
1.15
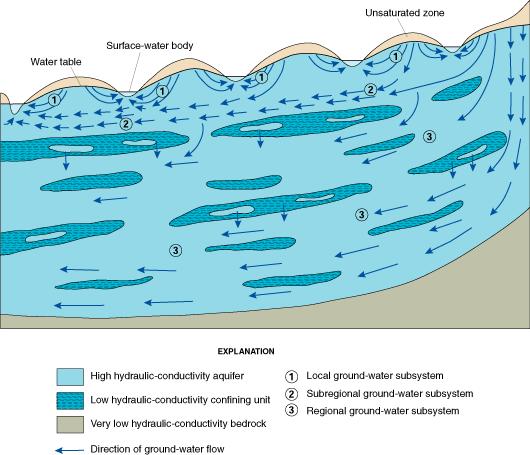
Direction of groundwater flow (U.S. Geological Survey).
1.16
Groundwater flow is a characteristically slow process.
1.17
Runoff is always moving from zones of higher potential to zones of lower potential.
1.18
Because the water table is nearly horizontal, groundwater flow is also nearly horizontal.
1.19
Groundwater flow is intercepted by surface flow in streams and rivers.
1.20
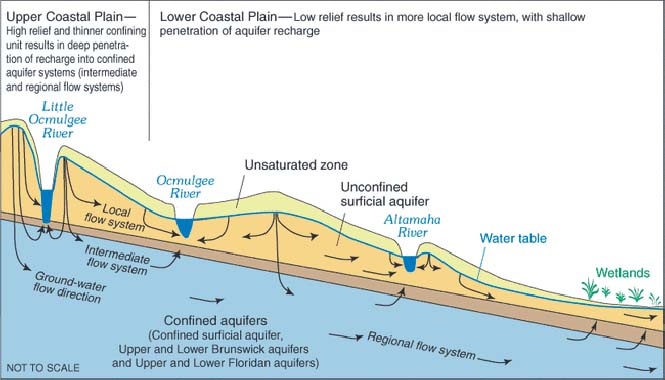
Direction of groundwater flow (U.S. Geological Survey).
1.21
Most groundwater flows into surface runoff before it reaches the ocean.
2. STREAM TYPES
2.01
Streams classify into three types:
1. perennial,
2. ephemeral, and
3. intermittent.
2.02
Perennial streams are those that always have flow.
2.03
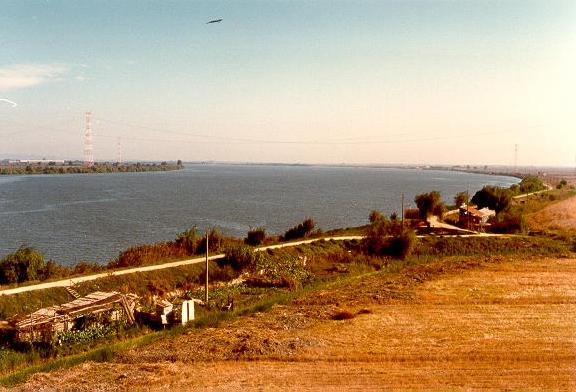
River Tagus at Villa Franca, Portugal.
2.04
During dry weather, the flow of perennial streams is baseflow, consisting mostly of groundwater flow.
2.05
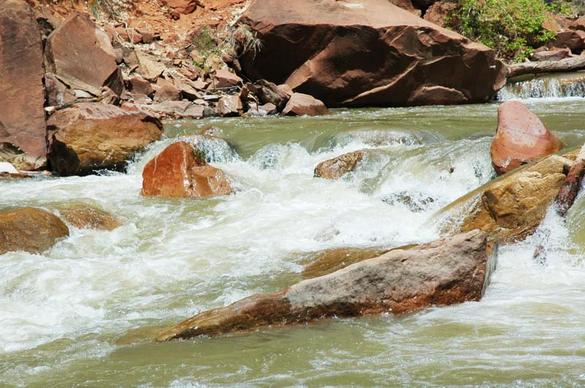
North Fork of the Virgin river, Utah.
2.06
Streams that feed from groundwater are referred to as effluent streams.
2.07
Perennial and effluent streams are typical of subhumid and humid regions.
2.08
Ephemeral streams flow only in direct response to precipitation.
2.09
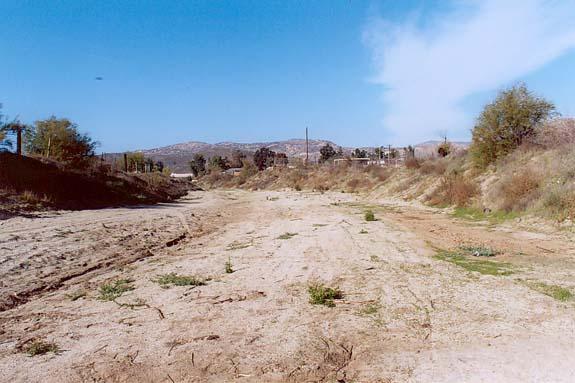
Joe Bill Creek, Tecate, Baja California, Mexico.
2.10
Ephemeral streams do not intercept groundwater and have no baseflow.
2.11
Ephemeral streams usually contribute to groundwater replenishment by seepage through their porous streambeds.
2.12
Streams that feed into groundwater are referred to as influent streams.
2.13
Channel abstractions from influent streams are referred to as channel transmission losses.
2.16
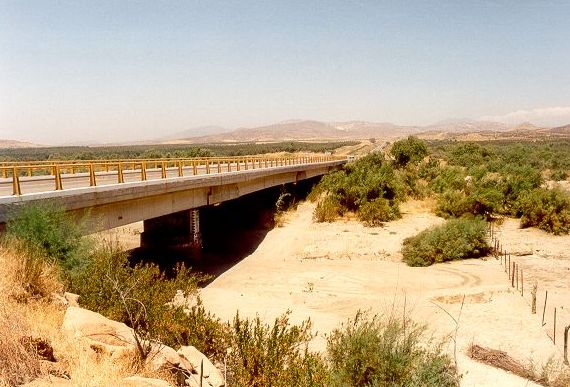
Las Palmas Creek, Baja California, Mexico.
2.14
Ephemeral and influent streams are typical of semiarid and arid regions.
2.15
Intermittent streams are those that have intermediate properties, behaving as either perennial or ephemeral, depending on the season.
2.16
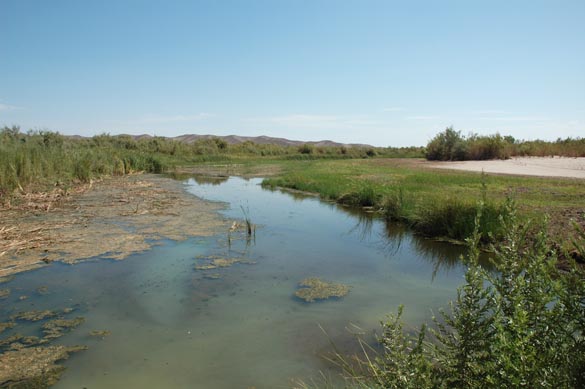
Gila river, near Wellton, Arizona.
2.17
The yield of a catchment is the volume of water delivered annually to its outlet.
2.18
Accurate estimations of baseflow are important in yield hydrology.
2.19
In flood hydrology, a knowledge of baseflow is necessary to
separate direct runoff from indirect runoff.
2.20
Baseflow is a measure of indirect runoff.
2.21
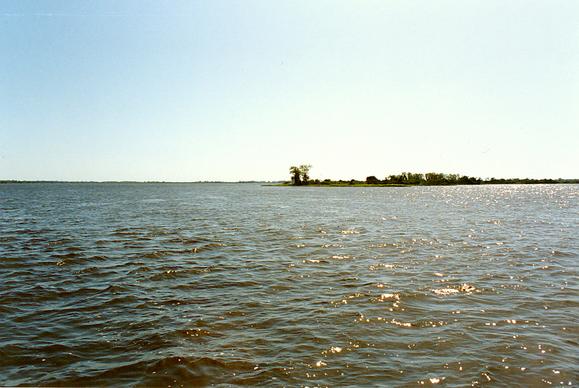
Upper Paraguay river near Porto Murtinho, Mato Grosso do Sul, Brazil.
2.22
Antecedent moisture is the moisture already present in a catchment at the start of the precipitation event.
2.23
Surface runoff is dependent on antecedent moisture.
2.24
The greater the antecedent moisture, the larger the amount of surface runoff.
2.25
A widely used method for antecedent moisture is the NRCS Antecedent Moisture Condition, or AMC, which characterizes antecedent moisture into:
* I (dry),
* II (average) and
* III (wet).
2.26
Rainfall is more readily measured than runoff.
2.27
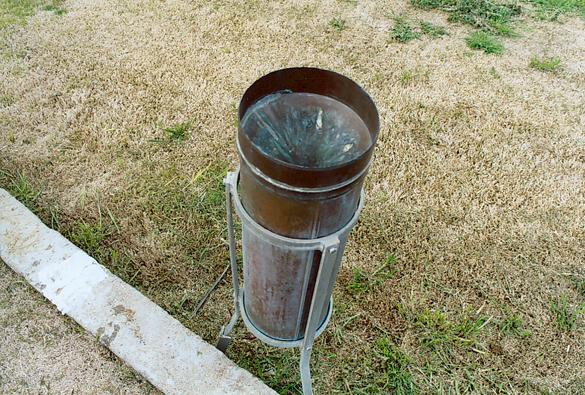
Rainfall gage at Campo, San Diego County, California.
2.28
From an engineering standpoint, the quantity of runoff is more important that the quantity of rainfall.
2.29
In practice, runoff is assessed indirectly through rainfall-runoff relations.
2.30
A basic linear model of rainfall-runoff is:
2.31
2.32
in which Q = runoff depth, P = rainfall depth, Pa = rainfall depth below which
runoff is zero, and b = slope of the line.
2.33
The NRCS runoff curve number method is a widely accepted nonlinear fit to rainfall-runoff data.
2.34
The method is conceptual, but based on empirical data.
3. RUNOFF CONCENTRATION
3.01
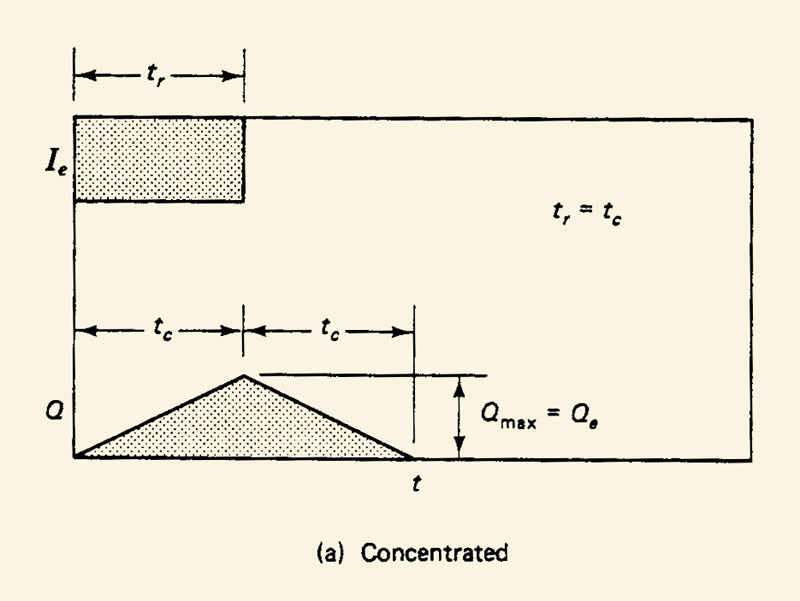
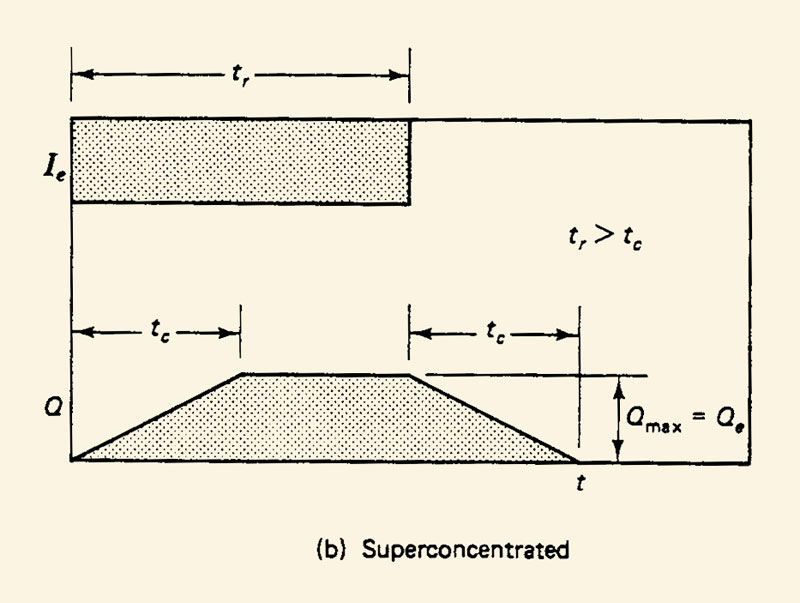
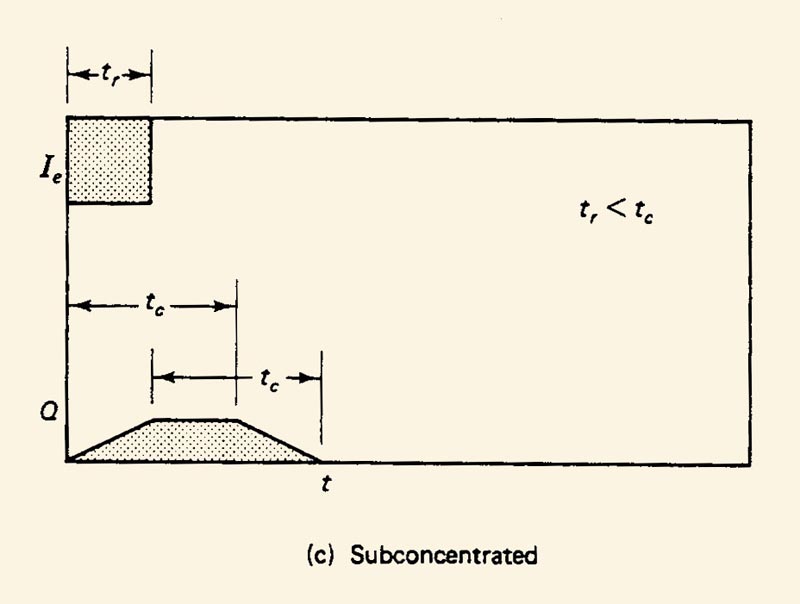
Assume that a storm falling on a given catchment produces a uniform effective rainfall intensity over the entire catchment.
3.02
If the effective rainfall lasts long enough,
runoff will concentrate at the catchment outlet.
3.03
Concentration means that the flow rate at the outlet will increase gradually from zero
to a constant maximum, or equilibrium, value.
3.04
The time it takes to achieve the maximum discharge is referred to as the time of concentration.
3.05
Under runoff concentration, the equilibrium flow rate is calculated as follows:
3.06
3.07
In SI units, the equilibrium flow rate is:
3.08
3.09
in which:
Qe = equilibrium flow rate, in Liters/second.
Ie = effective rainfall intensity, in mm/hr.
A = catchment area, in hectares.
3.10
There are three types of catchment flow:
1. superconcentrated,
2. concentrated,
3. subconcentrated.
3.11
3.12
Concentrated and superconcentrated flows are typical of small catchments, for which the hydraulic length is short.
3.13
Subconcentrated flows are typical of midsize and large catchments, for which the hydraulic length is long.
3.14
Concentrated catchment flow is the main assumption of the rational method used in urban drainage design.
3.15
Suboncentrated catchment flow is the main assumption of the unit hydrograph methodologies.
3.16
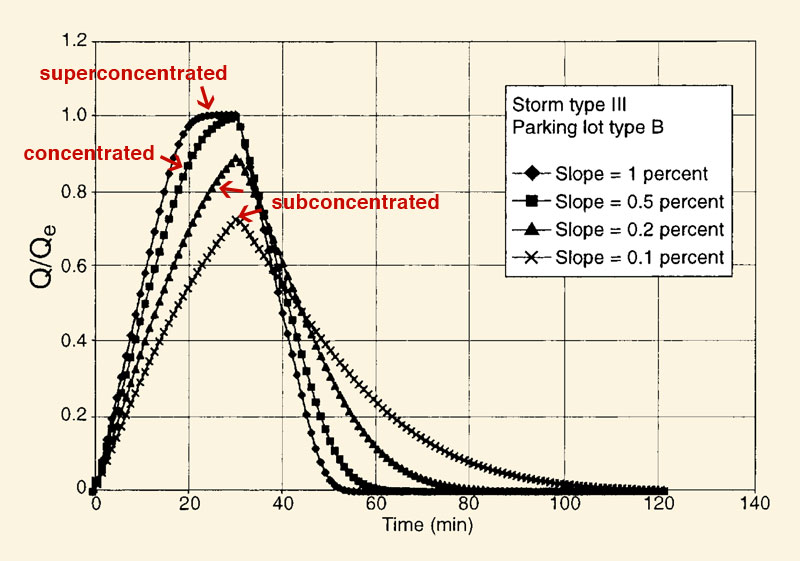
Modeling of runoff concentration in a parking lot.
3.17
Time of concentration is the time it takes a parcel of water to travel from the farthest point in the catchment divide to the outlet.
3.18
Time of concentration is a function of runoff rate.
3.19
Most formulas for time of concentration are empirical.
3.20
However, there are some theoretical formulas such as the time to equilibrium of the kinematic wave.
3.21
In urban drainage design, the Manning equation of open-channel flow is used to estimate time of concentration.
3.22
The concept of time of concentration is essentially unsteady, because it involves a flood wave.
3.23
The speed of travel of unsteady flow is usually somewhat larger than the speed of travel of steady flow.
3.24
Uncertainties in flow rate have blurred the distinction between steady and unsteady velocities in open-channel flow.
3.25
The Kirpich formula is a popular formula for time of concentration:
3.26
| tc = 0.06628 L0.77 S-0.385 | |
|
3.27
in which:
tc = time of concentration, in hr.
L = catchment length, in km.
S = catchment slope, in m/m.
3.28
The Hathaway formula is also popular:
3.29
| tc = 0.606 (L n)0.467 S-0.234 | |
|
3.30
in which n is the Manning's roughness coefficient.
3.31
The Papadakis-Kazan formula incorporates the four variables of length, slope, friction, and effective rainfall intensity:
3.32
| tc = 0.66 L0.50 n0.52 S-0.31 i-0.38 | |
|
3.33
in which:
tc = time of concentration, in minutes
L = catchment length, in feet.
n = Manning's roughness coefficient.
S = catchment slope, in feet/feet.
i = effective rainfall intensity, in inches per hour.
4. RUNOFF DIFFUSION
4.01
In practice, catchment response exhibits a more complex behavior than that which
could be attributed solely to runoff concentration.
4.02
Nonuniformities in spatial rainfall and catchment irregularities produce runoff diffusion.
4.03
Thus, surface runoff is subject to convection and diffusion.
4.04
Convection is properly runoff concentration.
4.05
Diffusion is the mechanism acting to spread the flows in time and space.
1.20
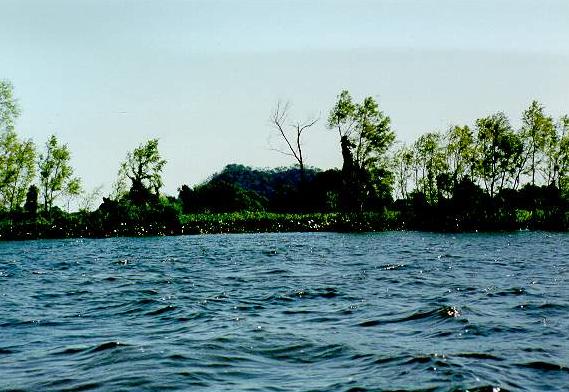
Upper Paraguay river near Porto Murtinho, Mato Grosso do Sul, Brazil.
4.06
Diffusion reduces the flow levels below those that could be attained by convection only.
4.07
Diffusion acts to smooth out catchment response.
4.08
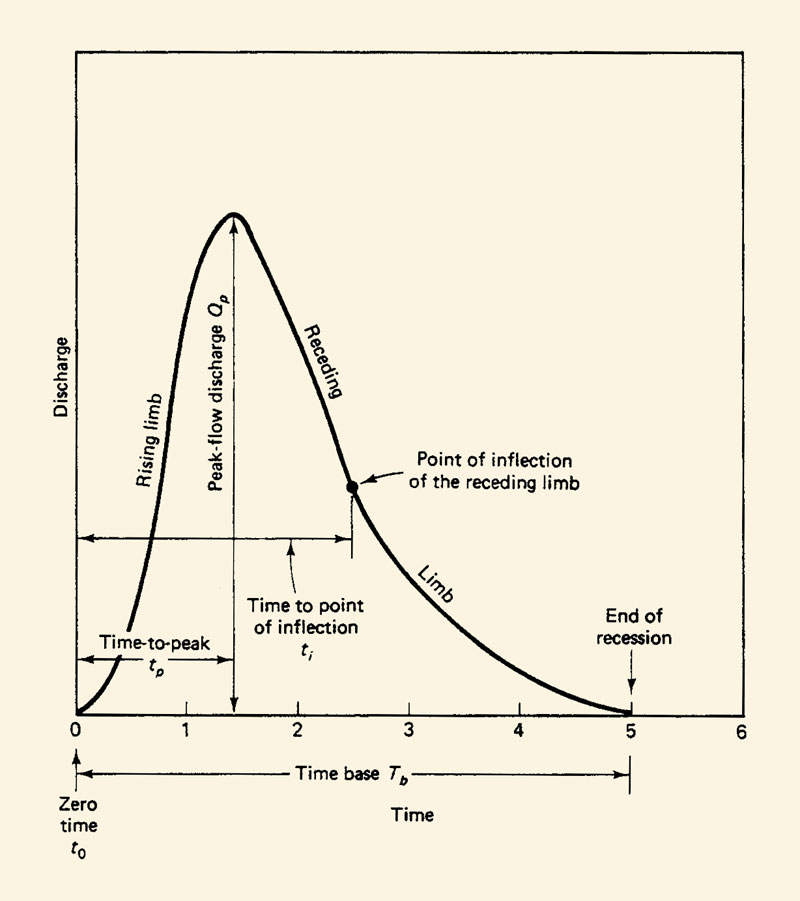
The resulting hydrograph is usually smooth and continuous.
4.09
The parts of a hydrograph are shown here.
4.10
5. FLOW IN STREAM CHANNELS
5.01
Mean flow depths vary from as little as a fraction of a meter, to as large as about 60 meters for the Amazon, the greatest river in the
world.
5.02
In stream and river flow, channel top widths vary from a few meters to a few kilometers.
5.03
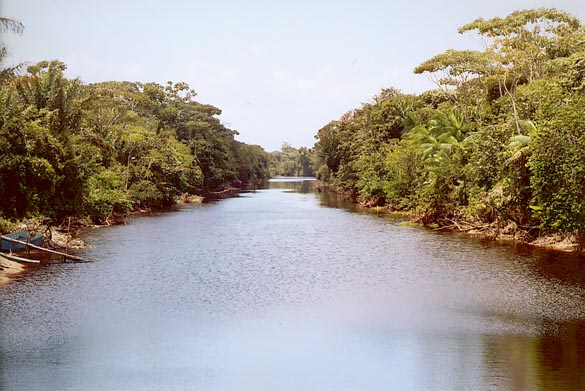
Bonasika Creek, Region 3, Guyana.
5.04
Typical width-to-depth or aspect ratios vary from about 10 to more than 100.
5.05
The Manning formula for open-channel flow remains popular in practice.
5.06
In SI units, the Manning formula is:
5.07
5.08
The formula implies that the friction coefficient is a constant.
5.09
However, experience has shown that n varies with stage and discharge in a natural channel.
5.10
The U.S. Geological Survey has documented the variation of Manning's n in a gamut of natural channels in the
range 0.024 to 0.075.
5.11
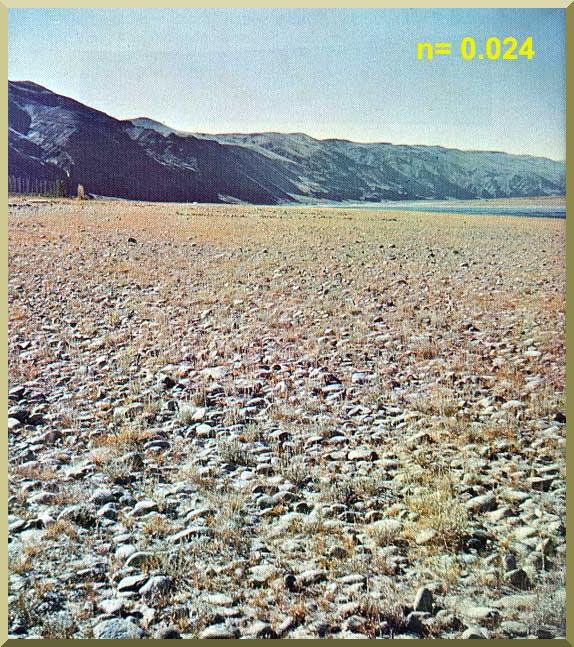
Columbia River at Vernita, Washington.
5.12
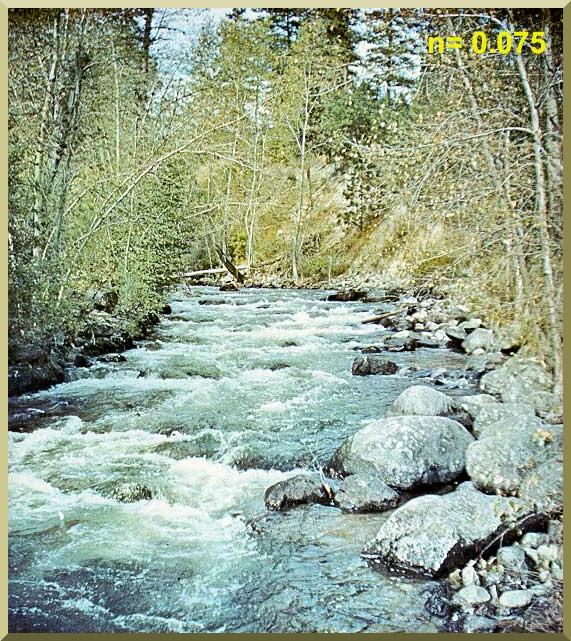
Rock Creek near Darby, Montana.
5.13
River stages vary with flow rate.
5.14
Flow rates can be grouped into:
* low,
* average, and
* high.
5.15
Low flows are typical of the dry season, consisting mostly of baseflow.
5.16
High flows occurs during the wet season, with direct runoff contributing the majority of the flow.
5.17
Average flows occurs in midseason.
5.18
The study of low flows is necessary to assess a minimum flow rate below which a specific use would be impaired.
5.19
This includes fisheries conservation, hydropower, navigation, and water quality.
5.20
Average flows are used in calculations of catchment yield.
5.21
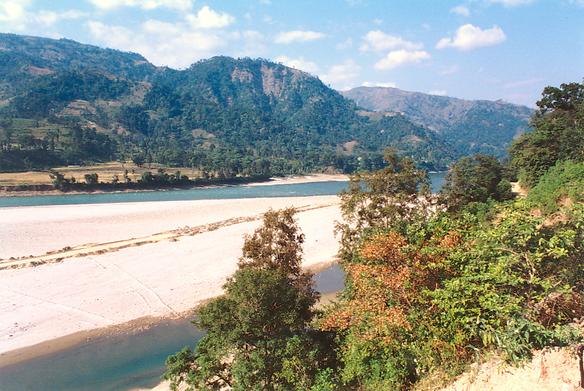
River Kosi, at the foothills of the Himalayas, Nepal.
5.22
High flows are used in flood control design and flood forecasting.
6. RATING CURVES
6.01
Given a sufficiently long prismatic channel, a single-valued relationship between stage and discharge at a given
cross-section defines the equilibrium or normal rating curve.
6.02
For steady uniform flow, the rating curve is unique. It can be calculated with a steady flow formula such as Manning's.
6.03
The property of uniqueness of the rating qualifies the channel reach as a channel control.
6.04
Nonuniformities and unsteadiness can cause deviations from the equilibrium rating.
6.05
Flood wave theory justifies a loop in the rating.
6.06
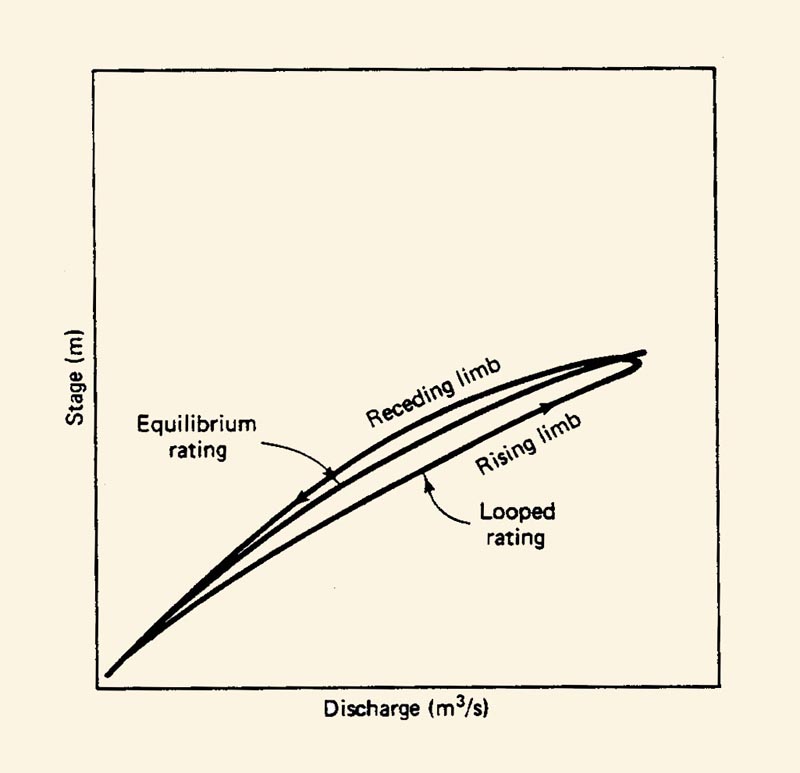
6.07
However, the loop is usually small and may be neglected on practical grounds.
6.08
Two other mechanisms have a bearing in the evaluation of stage-discharge relations:
* short-term and
* long-term
sedimentation effects.
6.09
In the short-term effect, the amount of boundary friction varies with flow rate.
6.10
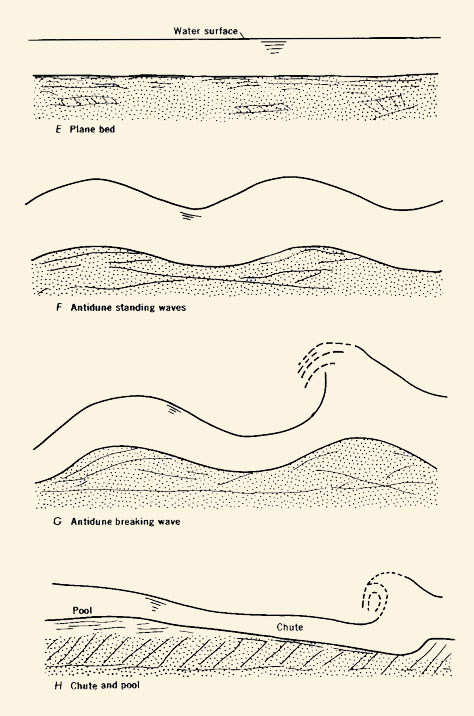
During low flow, the bed friction consists of grain and form friction.
6.11
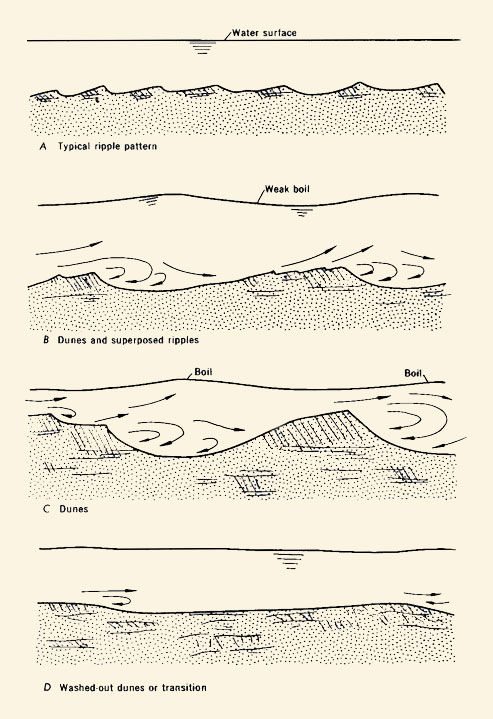
6.12
During high flows, form friction is obliterated, and friction reduces only to grain friction.
6.13
The reduced friction at high flows gives rivers the capability to carry a greater discharge for a given stage.
6.14
This explains the shift from a low-flow rating to a high-flow rating.
6.15
In the long-term sedimentation effect, rivers continuously subject their boundaries to recurring
cycles of erosion and deposition, depending on the sediment load they carry.
6.16
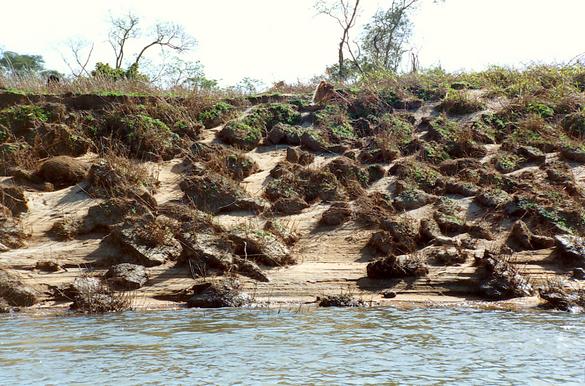
Bank erosion in the Apa river, Mato Grosso do Sul, Brazil.
6.17
Shifts in rating are the net result of these natural geomorphic processes.
6.18
In spite of their apparent complexity, rating curves are a useful tool in hydrologic analysis,
enabling the direct conversion of stage to discharge, and viceversa.
6.19
A widely used rating curve equation is the following:
6.20
6.21
The proper value of reference stage ho is that which makes the stage-discharge data plot as close as possible to a straight line on logarithmic paper.
6.22
Values of the constants a and b are determined by regression analysis.
7. STREAMFLOW VARIABILITY
7.01
Streamflow varies seasonally, annually, and with geographical location.
7.02
On a global annual basis, total runoff volume is about 40% of total precipitation volume.
7.03
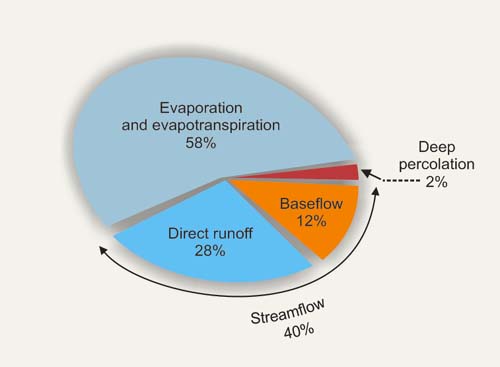
Global components of precipitation.
7.04
The rest is mostly accounted for by the combined effects of
evaporation and evapotranspiration, with a small leakage to deep percolation.
7.05
Theoretically, deep percolation avoids altogether the surface waters.
7.06
A runoff coefficient is the ratio of runoff volume to rainfall volume.
7.07
Runoff coefficients vary as a function of regional climate, geology, and geomorphology.
7.08
The runoff coefficient could be as low as 0.02, for instance, in Arizona,
and as high as 0.6-0.9 in unusual cases.
7.09
In the United States, the average runoff coefficient is about 0.25.
7.10
In humid climates, seasonal variability is not very marked.
7.12
For instance, the Amazon river has a ratio of peak-flow-to-low-flow of about 2.5.
7.13
Conversely, in arid climates, seasonal variability is very marked.
7.14
Streams in arid climates may have a ratio of peak-flow-to-low-flow of 1000 or more.
7.15
For ephemeral streams, with zero baseflow, this ratio is undefined.
7.16
In humid climates, there are substantial contributions from groundwater to surface water throughout the year.
7.17
In arid climates, the water table lies deep in the soil profile; therefore, there is no
contribution of groundwater to surface water.
7.18
Groundwater reservoirs serve as the mechanism for the storage of large amounts of water, which are slowly transported to lower elevations.
7.19
The process is slow and, therefore, subject to a substantial amount of diffusion.
7.20
In humid regions, the net effect is a permanent contribution to surface runoff in the form of baseflow.
7.21
Annual streamflow variability is linked to the relative contributions of direct runoff
and indirect runoff, the latter being largely baseflow.
7.22
During dry periods, rainfall goes on to replenish the catchment's soil moisture,
with little of it showing as direct runoff.
7.23
During wet periods, the catchment's storage capacity fills up quickly,
and any additional amount is entirely converted into direct runoff.
7.24
A possible line of inquiry is to focus on the mechanics of coupled surface runoff and groundwater flow.
7.25
The phenomenon is very complex, with ample spatial nonuniformity.
7.26
Over the past century, the reliance on statistics to compensate for the incomplete knowledge of the physical processes has led to the concept of flood frequency.
7.27
In this approach, a flood series is extracted from the stream gaging data.
7.28
The statistical analysis of the flood series allows the calculation of flow rates associated with selected frequencies.
7.29
The procedure is limited by the record length, that is, by the number of years of data.
7.30
For instance, a record length of 10 years would not be expected to produce an accurate value of the 100-yr flood.
7.31
Two variables help describe the geographical variability of streamflow:
* catchment area, and
* mean annual precipitation.
7.32
The volume available for runoff is directly proportional to the catchment area.
7.33
However, this volume is limited by the available precipitation.
7.34
Catchment area is important because larger catchments have milder overall gradients.
7.35
This causes greater runoff diffusion, while at the same time increasing the chances for infiltration.
7.36
The net effect is a decrease in peak discharge per unit area.
7.37
Peak flows are directly related to catchment area.
7.38
7.39
Due to runoff diffusion, the exponent n is generally less than 1.
7.40
Peak flow per unit area qpis:
7.41
7.42
in which: m = 1 - n.
7.43
This equation confirms that unit peak flow is inversely related to drainage area.
7.44
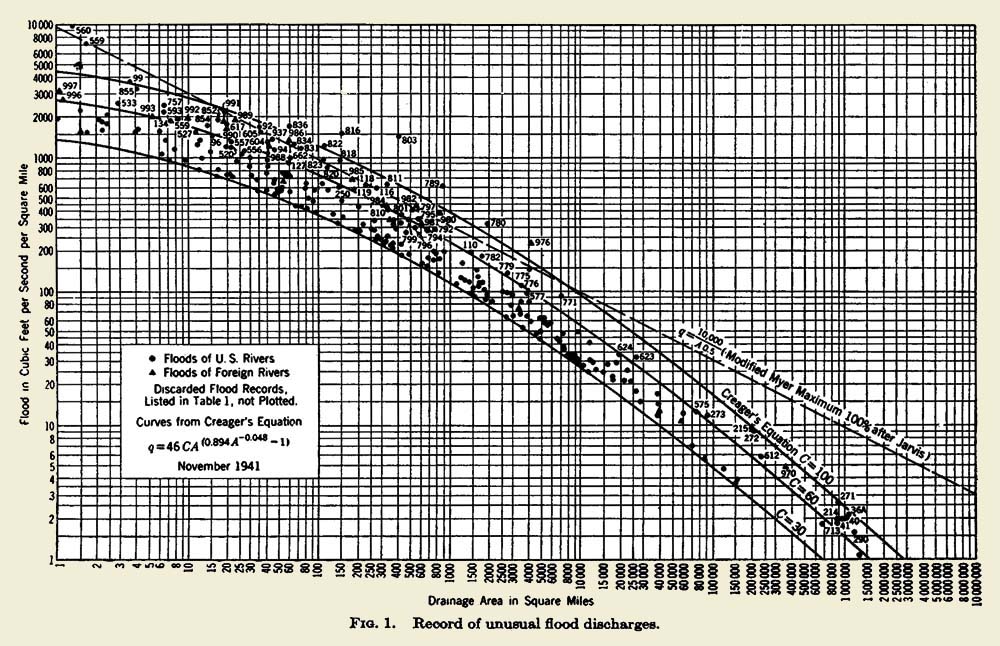
The Creager curves, dating back to the 1940s, are an early example of this natural trend.
7.45
7.46
The Creager formula is:
7.47
| qp = 46 C A(0.894 A-0.048 - 1) | |
|
7.48
in which qp is the discharge per unit of area, in cubic feet per second per square mile, and A is the catchment area in square miles.
7.49
Values of C in the range 30-100 encompass most of the data compiled by Creager.
7.50
This range can be taken as a measure of the regional variability of flood discharges.
7.51
However, there is no connotation of frequency in the calculated results.
Narrator: Victor M. Ponce
Music: Fernando Oñate
Editor: Flor Pérez
Copyright © 2010
Visualab Productions
All rights reserved
| 


