ENGINEERING HYDROLOGY: CHAPTER 031 -- HYDROLOGIC MEASUREMENTS
1. PRECIPITATION
1.01
Engineering hydrology is based on analysis and measurements.
1.02
Field measurements are necessary in order to complement and verify the analysis.
1.03
All types of hydrologic analyses benefit from measurements.
1.04
In particular, statistical hydrology is not possible without measurements.
1.05
Precipitation is measured with raingages.
1.06
A raingage is an instrument that captures precipitation and measures its accumulated volume during a certain period.
1.07
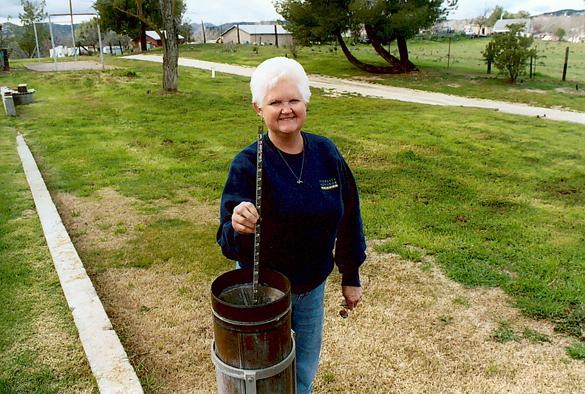
Raingage at Campo, California.
1.08
The precipitation depth is the accumulated volume divided by the collection area of the gage.
1.09
Raingages can be of the nonrecording or recording type.
1.10
In a nonrecording raingage, rain is caught in the collector and funneled to a measuring tube, of area equal to 1/10th
of that of the collection element.
1.11
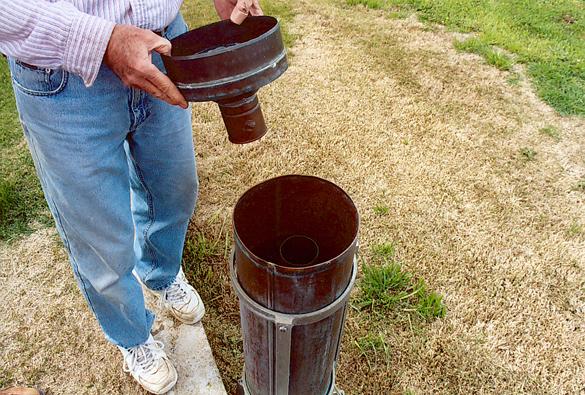
Nonrecording raingage at Campo, California.
1.12
Recording raingages can be of three types:
(1) tipping bucket,
(2) weighing gage,
and
(3) float chamber gage.
1.13
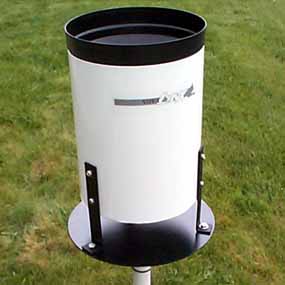
Tipping bucket raingage (NovaLynx Corporation).
1.14
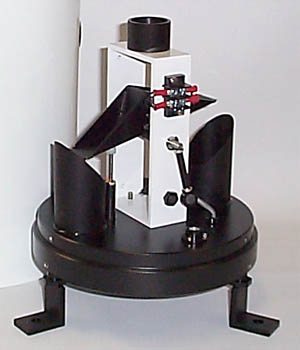
Inside view of tipping bucket raingage (NovaLynx Corporation).
1.15
A series of raingages constitutes the raingage network.
1.16
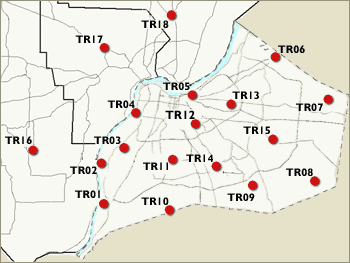
Telemetric raingage network of the Metropolitan Sewer District, Louisville-Jefferson County, Kentucky.
1.17
Sampling errors increase with rainfall depth.
1.18
Sampling errors decrease with network density, storm duration, and catchment area.
1.19
The error variability in precipitation is likely to be less than the
error variability in rainfall-runoff model calibration.
1.20
Precipitation and related climatic data are measured in real time and transmitted to data-processing centers
with the aid of telemetry.
1.21
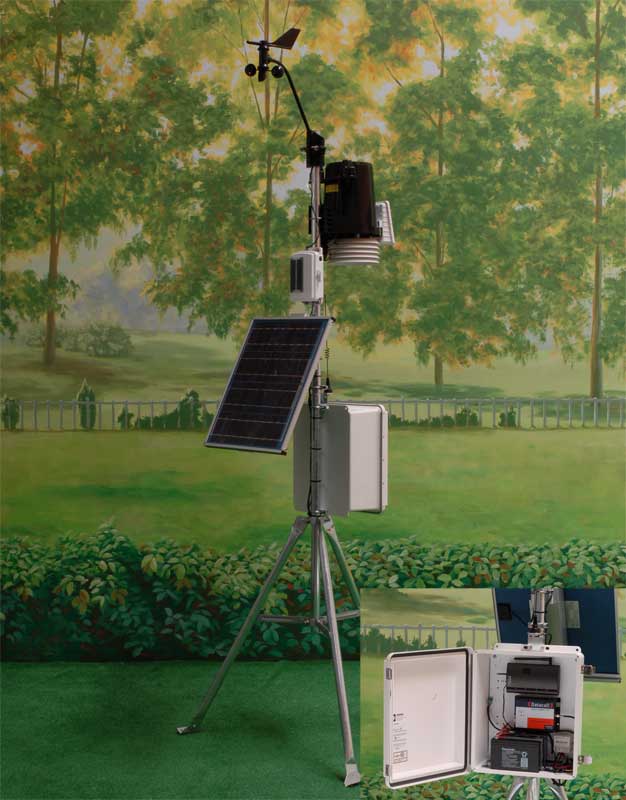
Telemetric weather station (Davis).
1.22
The National Weather Service operates a Doppler Radar system to measure the
temporal and spatial variability of precipitation across the United States.
2. SNOWPACK
2.01 Water Equivalent
Snowpack measurements are expressed in terms of water equivalent, that is, the depth of water
obtained after melting a certain depth of snowpack.
2.02
Water equivalent data are useful in water yield forecasts.
2.03 Snowpack measurements
To determine water equivalent, snowpack must be measured at several points.
2.04
A snowboard is placed on the ground to permit the accumulation of snow over it.
2.05
An inverted cylinder is used to isolate a core of the new snow.
2.06
Replacing the snowboard so that it is ready to receive fresh snow allows the
accumulated total snowfall to be known.
2.07 Snow density
Snow density is the ratio of the volume of snowmelt
to the initial volume of the sample.
2.08
Snowpack measurements and known snow densities are used to determine
the water equivalent of the snowpack.
2.09
The Mount Rose sampler is commonly used in the United States.
2.10
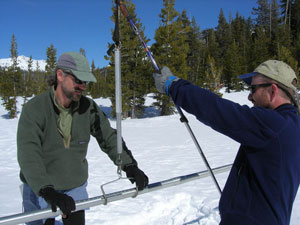
Weighing a Mount Rose sampler (National Park Service).
2.11 Snow courses
Snow courses are selected with the objective of obtaining representative data
from a given area.
2.12
Snow courses are positioned so that they are representative not only of snowfall but also of snowmelt.
2.13
Five snow-course sample points are usually adequate for well positioned snow courses with a minimum of irregularities caused by drifting or wind erosion.
2.14 Catchment water equivalent
The catchment water equivalent is based on point values from several snow courses.
2.15
Elevation is important in converting point values into catchment water equivalent.
2.16 Snow chart
A snow chart is a plot showing the variation of water equivalent with elevation.
2.17
This chart is used together with the catchment's hypsometric curve to determine the catchment's
water equivalent.
2.18
The catchment's elevation difference is divided into several equal increments.
2.19
For each increment of elevation, a subarea is obtained from the hypsometric curve.
2.20
For each increment of elevation, a water equivalent is obtained from the snow chart.
2.21
The catchment water equivalent is obtained by weighing the individual water equivalents in proportion to their respective subareas.
3. EVAPORATION AND EVAPOTRANSPIRATION
3.01
Evaporation pans are used to measure evaporation in the field.
3.02
The pan evaporation measurement differs from the actual evaporation due to the effect of local conditions.
3.03
The pan measurement is greater than the actual evaporation in the lake or reservoir.
3.04
Therefore, a pan coefficient less than 1 is applied to the pan evaporation measurement in order to arrive at the actual value of
lake or reservoir evaporation.
3.05
The NWS Class A pan is the most widely used evaporation pan in the United States.
3.06
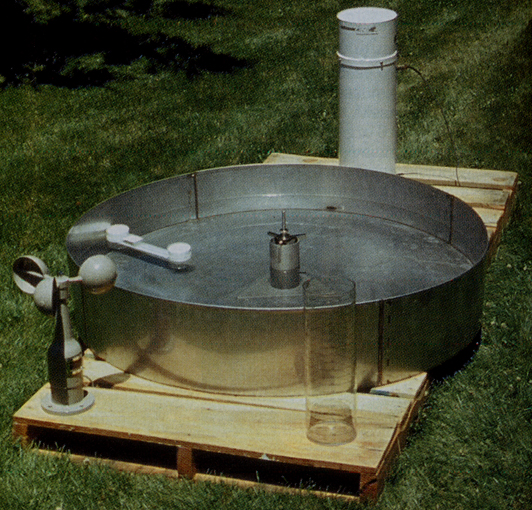
NWS Class A evaporation pan (University of Iowa).
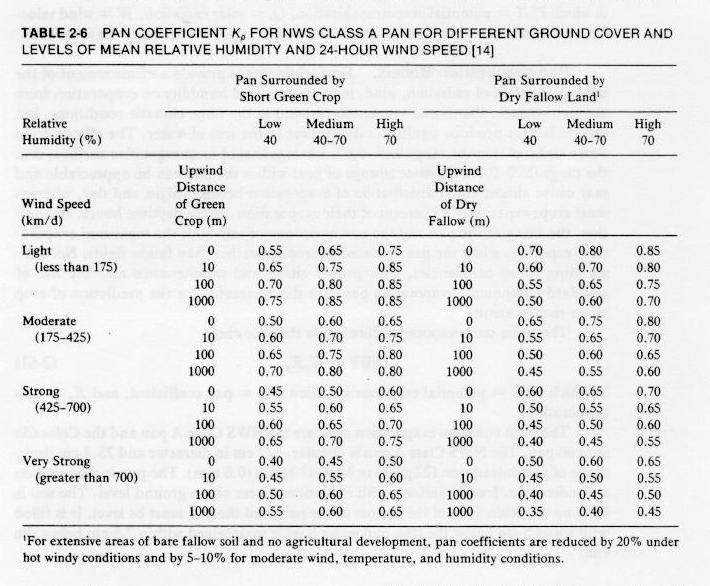
3.07
Class A pan coefficients are shown in the following table.
3.08
3.09
The spatial variability of evaporation does not appear to be as large as that of precipitation.
3.10
A density of one station per 5000 km2 may be sufficient.
3.11 Evapotranspirometers
Evapotranspirometers measure potential evapotranspiration.
3.12
An evapotranspirometer consists of a central tank and at least two other watertight soil tanks.
3.13
During one time period, the difference between the amount of water input to the soil tanks and the amount of water accumulated in the respective
collecting can is the water lost to evapotranspiration.
3.14
Proper allowance must be made for possible changes in moisture storage in the soil tanks.
3.15 Lysimeters
Lysimeters measure actual evapotranspiration.
3.16
Actual evapotranspiration is much more difficult to measure than potential evapotranspiration.
3.17
The actual rate is determined not only by climatic factors, but also by the ability of the plant to
extract water from the soil and the speed of movement of soil moisture to the plant roots.
3.18
A properly constructed lysimeter must be representative of the surrounding area.
3.19
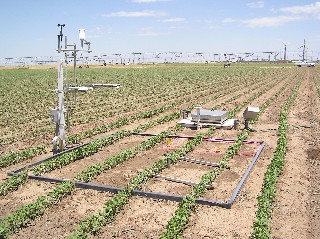
A USDA Agricultural Research Service lysimeter.
3.20
The size of a lysimeter tank is usually much greater than that of an evapotranspirometer tank.
3.21
The larger the tank, the lesser the influence of edge effects.
3.22
The monolith lysimeters at
Coshocton, Ohio, built in the late 1930s, are 2.4 m deep, 4.3 m long, and 1.9 m wide.
3.23
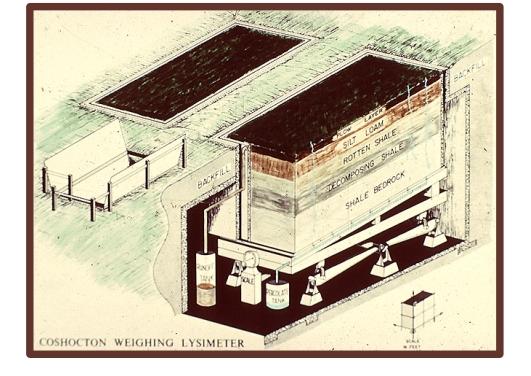
A Coshocton weighing lysimeter (USDA ARS North Appalachian Experimental Watershed, Coshocton, Ohio)
4. INFILTRATION
4.01
Infiltration rates vary greatly, in both time and space.
4.02
Infiltration rates are determined either by the use of infltrometers, or by the analysis of rainfall-runoff data.
4.03
Infiltrometers are instruments designed to measure the rate at which water is absorbed by the soil surface enclosed within a small, clearly defined area.
4.04
There are two types:
1. flooding infiltrometer, and
2. sprinkler infiltrometer.
4.05 Flooding infiltrometer
A flooding infiltrometer consists of two concentric metal rings, inserted a distance of 2 to 5 cm into the ground.
4.06
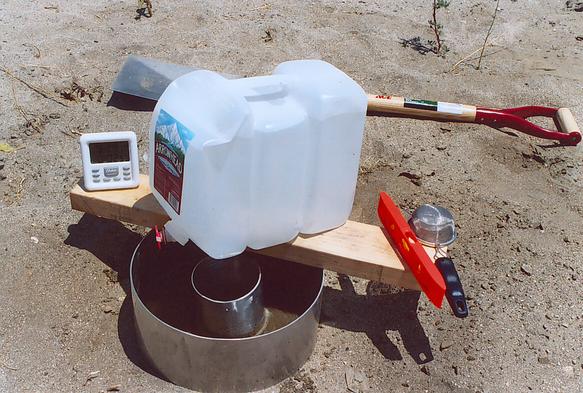
Flooding infiltrometer.
4.07
To prevent the water from spreading laterally below the ground surface, the same head of water
is maintained inside and outside the inner ring.
4.08
The infiltration rate measured with a flooding infiltrometer is different than the actual infiltration rate.
4.09
Head differences between inner and annular spaces are likely to cause divergence.
4.10
Moreover, the flooding method is usually not representative of actual field conditions.
4.11
A large number of tests are required to assess the spatial variability of infiltration.
4.12 Sprinkler infiltrometer
The sprinkler infiltrometer applies a simulated rainfall condition to a small plot using sprinklers.
4.13
The simulated rainfall is continued for as long as necessary to attain an equilibrium runoff condition at the plot outlet.
4.14
The infiltration rate is calculated as the difference between the constant rainfall rate and the constant runoff rate,
expressed
in the same units.
4.15
Due to the spatial and temporal variability of infiltration,
field measurements can provide qualitative information, best suited for comparative studies.
4.16
Actual field conditions are more likely to be obtained from methods based on rainfall-runoff analysis.
4.17
The use of rainfall-runoff data to determine infiltration rates is an extension of the sprinkler
infiltration technique.
4.18
For a storm with a single runoff peak, the procedure resembles the calculation of a φ-index.
4.19
The rainfall hyetograph is integrated to calculate the total rainfall volume.
4.20
The runoff hydrograph is integrated to calculate the total runoff volume.
4.21
The difference between rainfall and runoff volumes is the infiltrated volume.
4.21
The infiltrated depth is the infiltrated volume divided by the catchment area.
4.22
The average infiltration rate is equal to the infiltrated depth divided by the rainfall duration.
4.23
For large basins, the time elapsed between rainfall and runoff may be so great
that it may be practically impossible to determine the amount of runoff produced by a storm event
within a reasonable length of time.
4.24
In practice, this limits infiltration analysis based on rainfall-runoff
data to small and midsize catchments, for which long-term storage is negligible.
Narrator: Victor M. Ponce
Music: Fernando Oñate
Editor: Flor Pérez
Copyright © 2010
Visualab Productions
All rights reserved


