|
ENGINEERING HYDROLOGY: CHAPTER 032 -- STREAMFLOW MEASUREMENTS
1. RATING CURVES
1.01
Discharge at a given location can be evaluated by
- direct method: measuring the flow area and mean velocity of the stream.
- indirect method: measuring the stage and using a rating curve to convert the stage to discharge.
1.02
A good rating curve is crucial to the determination of discharge by the indirect method.
1.03
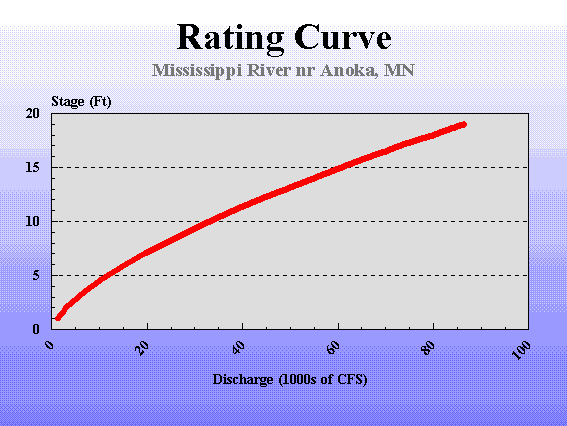
Rating curve (National Weather Service).
1.04
The quality of a rating is evaluated in terms of its stability and permanence.
1.05
A stable rating remains constant in time, that is,
the effects of flow nonuniformity, unsteadiness, or erosion and sedimentation are negligible.
1.06
A permanent rating is one that is not likely to be disturbed by human activities.
1.07
The stage-discharge rating should be closed to being single-valued, that is, to feature
a one-to-one correspondence between discharge and stage.
1.08
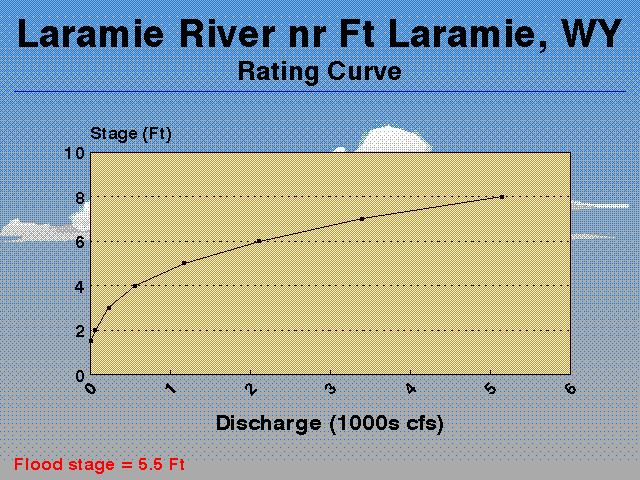
Rating curve (National Weather Service).
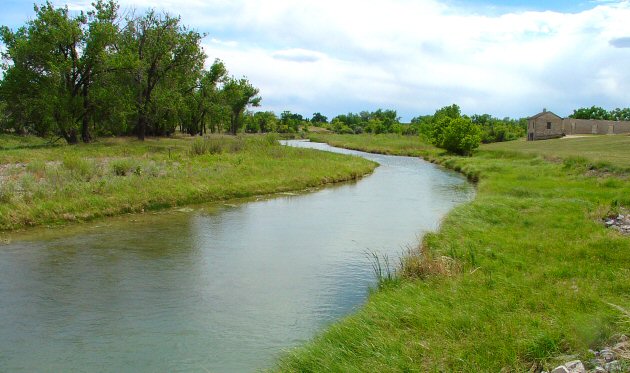
Laramie river near Ft. Laramie, Wyoming.
1.09
Either section or channel control is necessary for the rating to be single-valued.
1.10
A section that forces critical flow provides a section control.
1.11
A widely used critical flow flume is the Parshall flume, developed in the 1920s by R. L. Parshall.
1.12
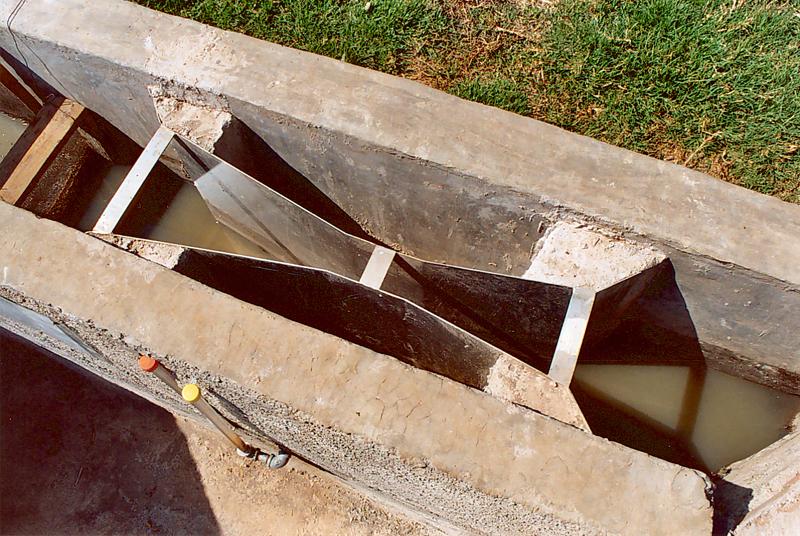
Parshall flume, Cucuchucho constructed wetland, Michoacan, Mexico.
1.13
A long channel of relatively uniform cross-sectional shape, constant slope, and bottom friction, provides a channel control.
1.14
A gaging site relying on channel control requires periodic calibration to check its stability.
1.15
A gaging station should be located far from downstream backwater effects caused by reservoirs, large river confluences, or tides.
2. STAGE MEASUREMENTS
2.01 Staff gage
The vertical staff gage is vertically attached to a bridge pier, pile, or rock.
2.02
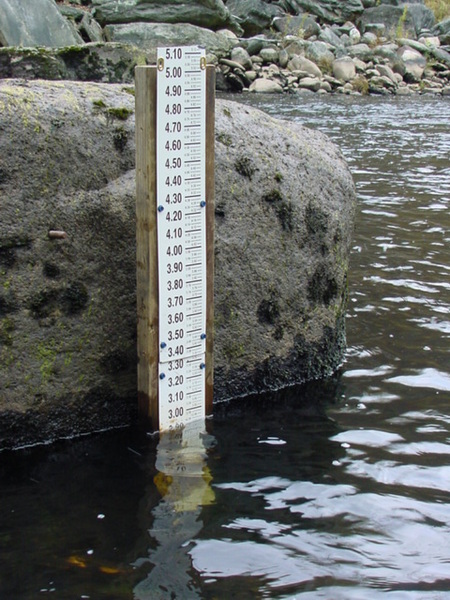
Staff gage (Massachussets Department of Fish and Game).
2.03 Sectional staff gages
Sectional staff gages are used to increase accesibility.
2.04
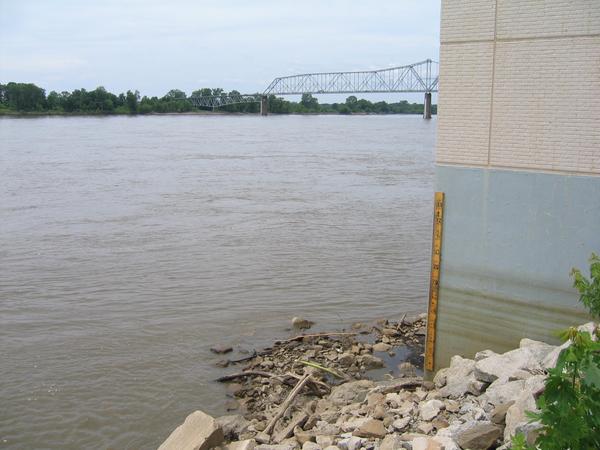
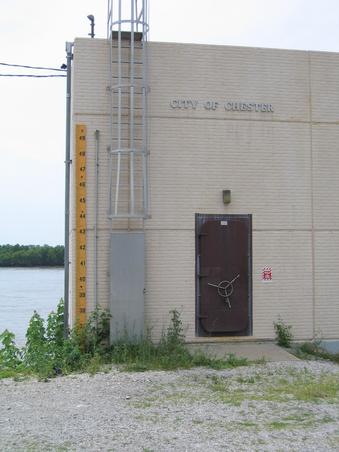
Lower and upper sections, staff gage, Mississippi river at Chester, Illinois (National Weather Service).
2.05
Highwater staff gages are increasingly being used to record stages for extreme floods, as shown in this flooplain photo of Sweetwater Creek, near Austell,
Georgia.
2.06
The height of the September 2009 flooding is indicated by the red line at the top.
2.07
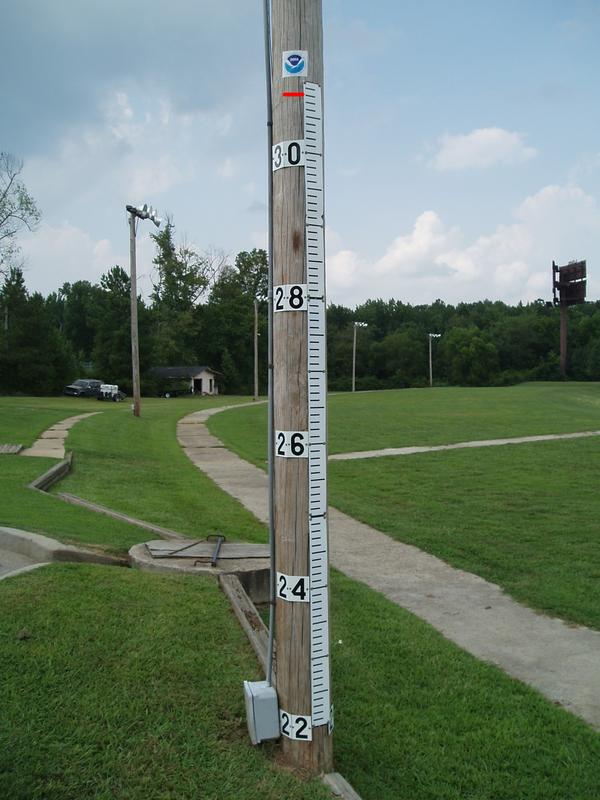
Highwater staff gage, Sweetwater Creek, near Austell, Georgia, installed on August 27, 2010 (National Weather Service).
2.08
A recording gage measures stages continuously and records them on a strip chart.
2.09
Self-reporting gages have automatic data transmittal capabilities.
3. DISCHARGE MEASUREMENTS
3.01
A discharge measurement requires the determination of flow area and mean velocity for a given stage and cross section.
3.02
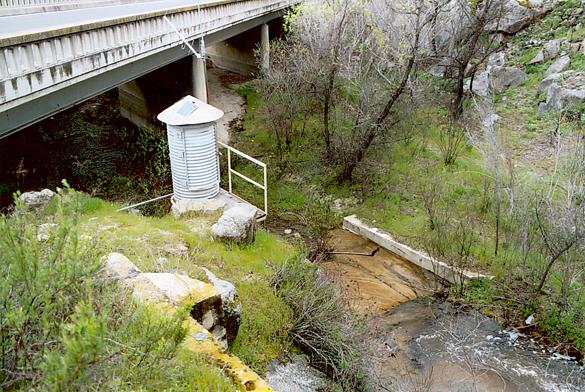
USGS stream gaging station, Campo Creek at Campo Road, San Diego County, California.
3.03
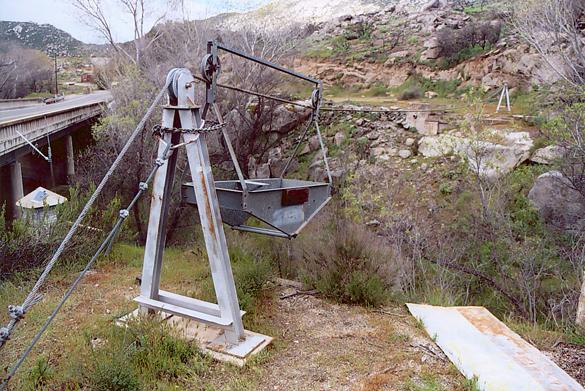
USGS stream gaging station, Campo Creek at Campo Road, San Diego County, California.
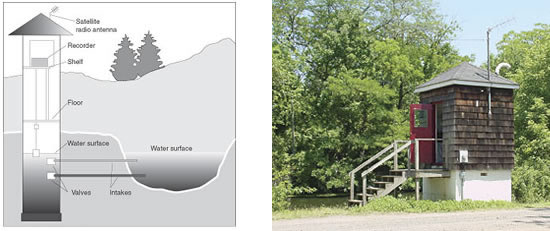
USGS stream gaging station.
3.04
Mean velocity should be based on a sufficient number of velocity measurements across the section.
3.05
In a typical stream gaging procedure, each of 20 to 30 depth soundings define the position of a vertical.
3.06
A partial section is a rectangle of depth equal to the sounding, and of width equal to half the difference of the distance to adjacent verticals.
3.07
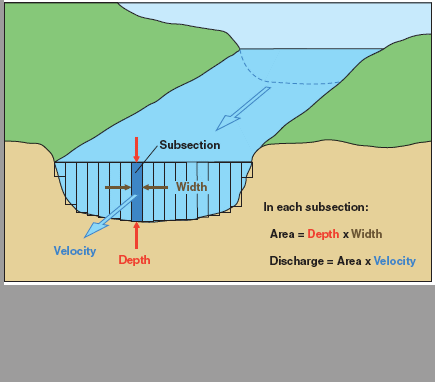
How streamflow is measured (U.S. Geological Survey).
3.08
At each vertical, the following observations are made:
- the distance to a reference point on the stream or river bank
- the flow depth, and
- the velocity as measured with a current meter at 0.2 and 0.8 of the flow depth, and averaged.
3.09
In shallow streams, a single measure at 0.6 of the flow depth, measured from the water surface, is usually sufficient.
3.10
For each partial section, the discharge is calculated as follows:
3.11
3.12
in which q = discharge, v = mean velocity, and a = flow area.
3.13
The stream discharge is the sum of the discharges of each partial section.
3.14 Current meters
Current meters measure flow velocity by counting the number of revolutions of the meter assembly.
3.15
The rotation axis can be vertical, leading to the cup meter, or horizontal, leading to the propeller meter.
3.16
The Price cup current meter is in common use in the United States.
3.17
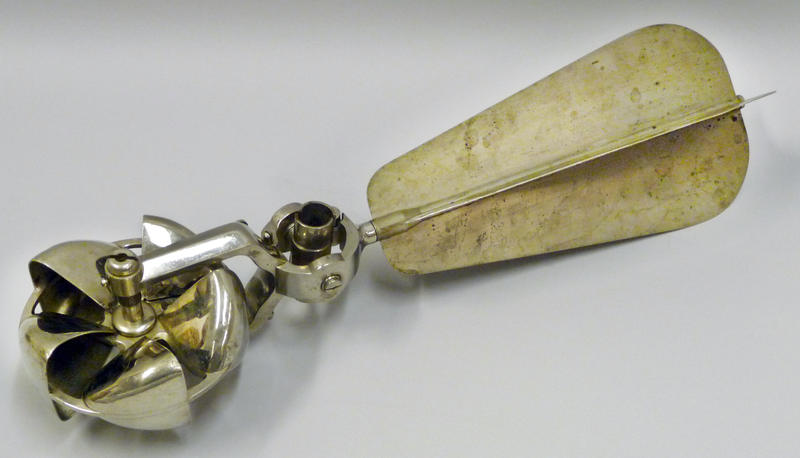
Price current meter (U.S. Geological Survey).
3.18
An expedient way of measuring velocity is to time the travel of floats.
3.19
A surface float travels with a speed that is about 1.2 times the mean velocity of the stream.
3.20
Chemical methods are used in places where it is impractical to use a current meter.
3.21
Such is the case of shallow streams, very large rivers, or tidal flow.
3.22
Chemical methods are classified as: (1) tracer methods, and (2) dilution methods.
3.23
In the tracer method, a tracer substance is injected into the stream, and the time of travel to a point or points
donwstream is monitored.
3.24
In the dilution method, a concentrated solution of a substance is introduced at a constant rate at a source point.
3.25
Further downstream, after complete mixing has taken place, the flow is sampled to determine the equilibrium concentration of the mixture.
3.26
A mass balance leads to the following equation:
3.27
3.28
in which
Q = stream discharge,
Cs = concentration of the substance solution at the source,
Ce = equilibrium concentration of mixture at the sampling point,
Qs = rate of inflow of substance solution at the source.
3.29 Ultrasonic flow meter
In the ultrasonic flow meter, two sonic pulses are emitted and received, each at opposite sides of the stream or river.
3.30
The instruments are located along a diagonal line, making a 45 degree angle with the flow direction.
3.31
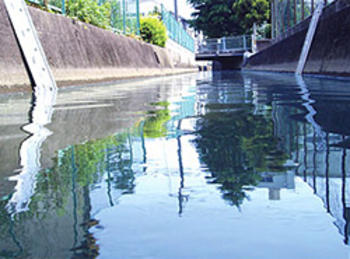
Setup of ultrasonic flow meter (JFE Advantech).
3.32
Therefore, one pulse travels with the current, and the other against it.
3.33
The difference in travel time between the two pulses is related to the longitudinal flow velocity.
3.34
The ultrasonic flow meter is applicable to large rivers, where current meters and other techniques are not feasible.
3.35
It is also been used in urban settings.
4. THE SLOPE-AREA METHOD
4.01
The high stages and swift currents that prevail during floods combine to increase the risk of accident and bodily harm.
4.02
Therefore, it is generally not possible to measure peak discharge during the passage of a flood.
4.03
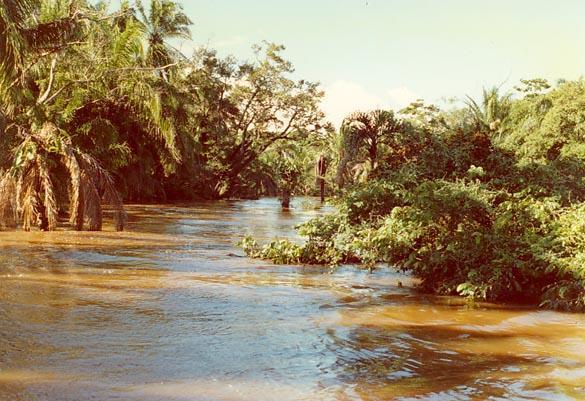
Flood stage on the Chane river, Bolivia, on January 19, 1990.
4.04
An estimate of peak discharge can be obtained by the slope-area method.
4.05
To apply the slope-area method for a given stream or river reach, the following data are required:
- The reach length.
- The fall, i.e., the mean change in water surface elevation through the reach.
- The flow area, wetted perimeter, and velocity head coefficients at upstream and downstream cross sections.
- The average value of Manning's n for the reach.
4.06
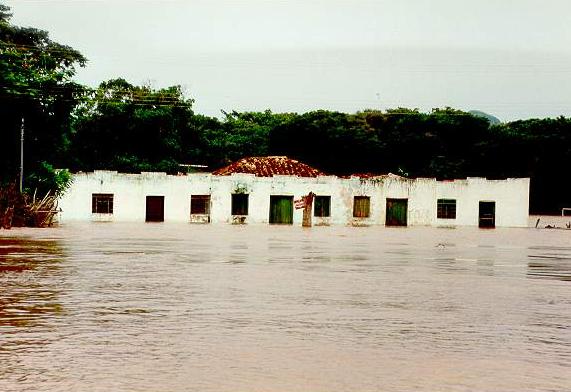
Flood stage on the Cuiaba river, Brazil, on January 15, 1995.
4.07
High-water marks should be readily recognized.
4.08

Local man showing high water mark, Malaprabha basin, Karnataka, India.
4.09
The reach should be sufficiently long so that fall can be measured accurately.
4.10
The reach should be relatively straight, although a contracting reach is preferred over an expanding reach.
4.11
The accuracy of the slope-area method improves as the reach length increases.
4.12
A suitable reach should satisfy one or more of the following criteria:
- The ratio of reach length to hydraulic depth should be greater than 75.
- The fall should be greater than or equal to 0.15 m.
- The fall should be greater than either of the velocity heads computed at the upstream and downstream cross sections.
4.13 slopearea.sdsu.edu
The steps in the application of the slope-area method are the following:
4.14
1. Compute the conveyances at upstream and downstream cross sections:
4.15
4.16
2. Compute the reach conveyance, equal to the geometric mean of upstream and downstream conveyances:
4.17
4.18
3. Calculate the first approximation to the energy slope:
4.19
4.20
in which
S = first approximation to the energy slope, and
L = reach length.
4.21
4. Calculate the first approximation to the peak discharge:
4.22
4.23
5. Calculate the velocity heads at the upstream and downstream cross sections:
4.24
4.25
6. Calculate an updated value of the energy slope:
4.26
4.27
in which k is a loss coefficient.
4.28
For expanding flow, where the flow area increases in the downstream direction: k = 0.5.
4.29
For contracting flow, where the flow area decreases in the downstream direction: k = 1.0.
4.30
7. Calculate an updated value of the peak discharge:
4.31
4.32
8. Repeat steps 5 to 7 until the new discharge is close to the old discharge.
4.33
This is usually accomplished within 3 to 5 iterations.
4.34
The slope-area method can be solved online using the SDSU Visualab's
slopearea.sdsu.edu
Narrator: Victor M. Ponce
Music: Fernando Oñate
Editor: Flor Pérez
Image Credits: Google
Copyright © 2010
Visualab Productions
All rights reserved
| 


