|
ENGINEERING HYDROLOGY: CHAPTER 055 - SYNTHETIC UNIT HYDROGRAPHS
1. SYNTHETIC UNIT HYDROGRAPHS
1.01
A synthetic unit hydrograph is that derived using an established formula, without the need for rainfall-runoff data analysis.
1.02
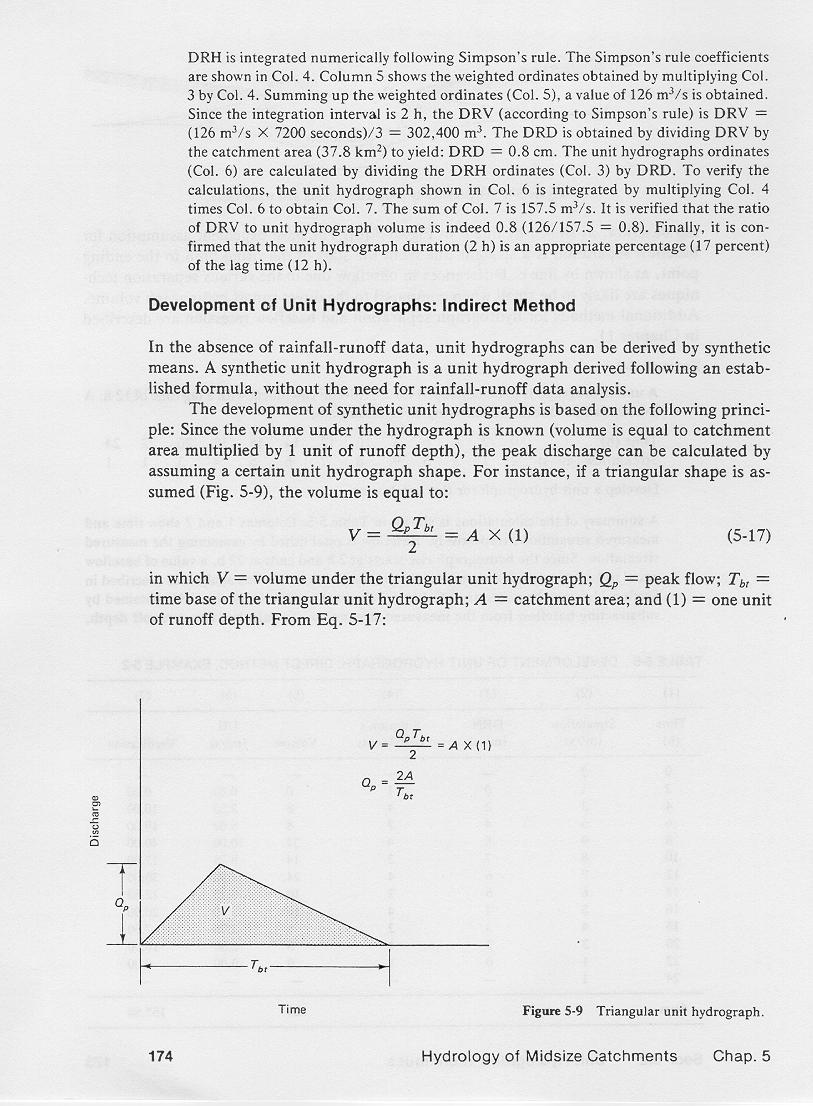
The volume of a unit hydrograph is equal to the catchment area multiplied by one unit of runoff depth,
either one centimeter or one inch.
1.03
1.04
Since the volume is known, the peak can be calculated by assuming the shape of the unit hydrograph.
1.05
For instance, if a triangular shape is assumed for simplicity, with peak Qp and triangular time base Tbt:
1.06

1.07
1.08
From this equivalence, the peak flow is obtained:
1.09
1.10
Synthetic unit hydrographs relate time base to catchment lag.
1.11
In turn, catchment lag is related to the response characteristics of the catchment, including
catchment shape, length, and slope.
1.12
Two synthetic unit hydrographs are in common use in the United States: (1) Snyder, and (2) Natural Resource Conservation
Service, or NRCS.
1.13

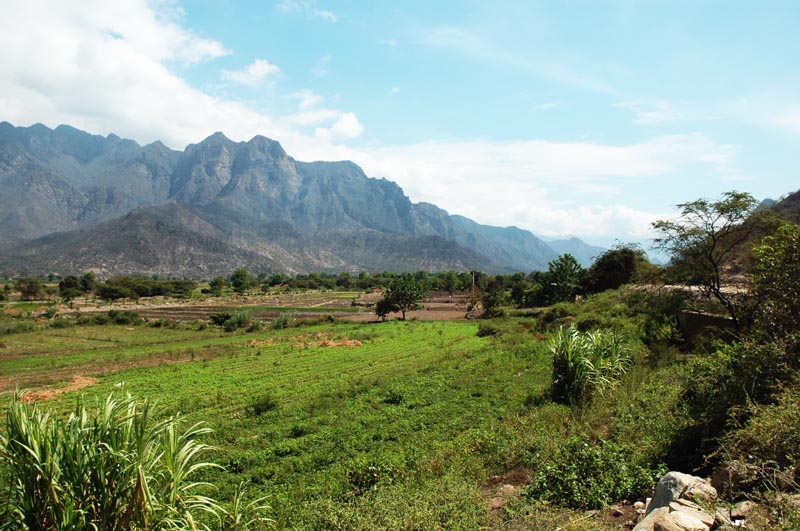
Valley of the La Leche river, Lambayeque, Peru.
2. SNYDER'S UNIT HYDROGRAPH
2.01
In 1938, Snyder introduced the concept of synthetic unit hydrograph.
2.01
The analysis of a large number of hydrographs from catchments in the U.S. Appalachian region
led to the following empirical formula:
2.02
2.03
in which:
tl = catchment lag;
L = hydraulic length;
Lc = length measured along main stream from the outlet to a point closest to the catchment centroid; and
Ct = a coefficient accounting for catchment gradient and associated storage.
2.04
With L and Lc in km, Ct varies in the range 1.35 to 1.65.
2.05
With L and Lc in mi, Ct varies in the range 1.8 to 2.2.
2.06
Snyder's formula for peak flow is:
2.07
2.08
Cp is an empirical coefficient related to the ratio of triangular time base to catchment lag, as follows:
2.09
2.10
Snyder gave values of Cp in the range 0.56-0.69, which are associated with Tbt/tl ratios in the range 3.57-2.90.
2.11
In SI units, the Snyder peak flow formula is:
2.12
2.13
in which Qp = peak flow for 1 cm of runoff, in m3/s;
A = catchment area in km2; and
tl = lag, in hours.
2.14
In U.S. Customary units, the Snyder formula is:
2.15
2.16
in which Qp = peak flow for 1 inch of runoff, in ft3/s;
A = catchment area in mi2; and
tl = lag, in hours.
2.17
In Snyder's method, the unit hydrograph duration is a fraction of the lag:
2.18
2.19
The unit hydrograph time-to-peak is equal to 1/2 of the storm duration plus the lag. Therefore:
2.20
2.21
Snyder included interflow as part of direct runoff.
2.22
This led to a somewhat longer time base.
2.23
The formula for time base is:
2.24
2.25
in which Tb and tl are in hours.
2.26
The Snyder method gives peak flow, time to peak, and time base.
2.27
These values can be used to sketch the unit hydrograph,
adhering to the requirement that unit hydrograph volume must be equal to 1 unit of runoff depth.
2.28
The parameter Ct is a funtion of catchment slope.
2.29
The dimensionless parameter Cp is a function of the runoff diffusion characteristics of the catchment.
2.30
The maximum value of Cp occurs in the absence of runoff diffusion.
2.31
In this case, Cp = 11/12.
2.32
The Snyder method is a two-parameter method, generally applicable for midsize catchments in the upper range, say, around 1000 km2, or 400 mi2.
2.33
It is extensively used in U.S. Army Corps of Engineers' practice.
3. NRCS UNIT HYDROGRAPH
3.01
The NRCS synthetic unit hydrograph is the dimensionless unit hydrograph developed by Victor Mockus in the 1950s.
3.02
The method fixes the ratio of triangular time base to time to peak to a constant value of 8/3:
3.03
3.04
This implies that in the NRCS unit hydrograph, the Snyder parameter Cp is constant and equal to 11/16.
3.05
This stresses the applicability of the NRCS unit hydrograph to the lower-range midsize basins, say from 1 to 100 square miles.
3.06
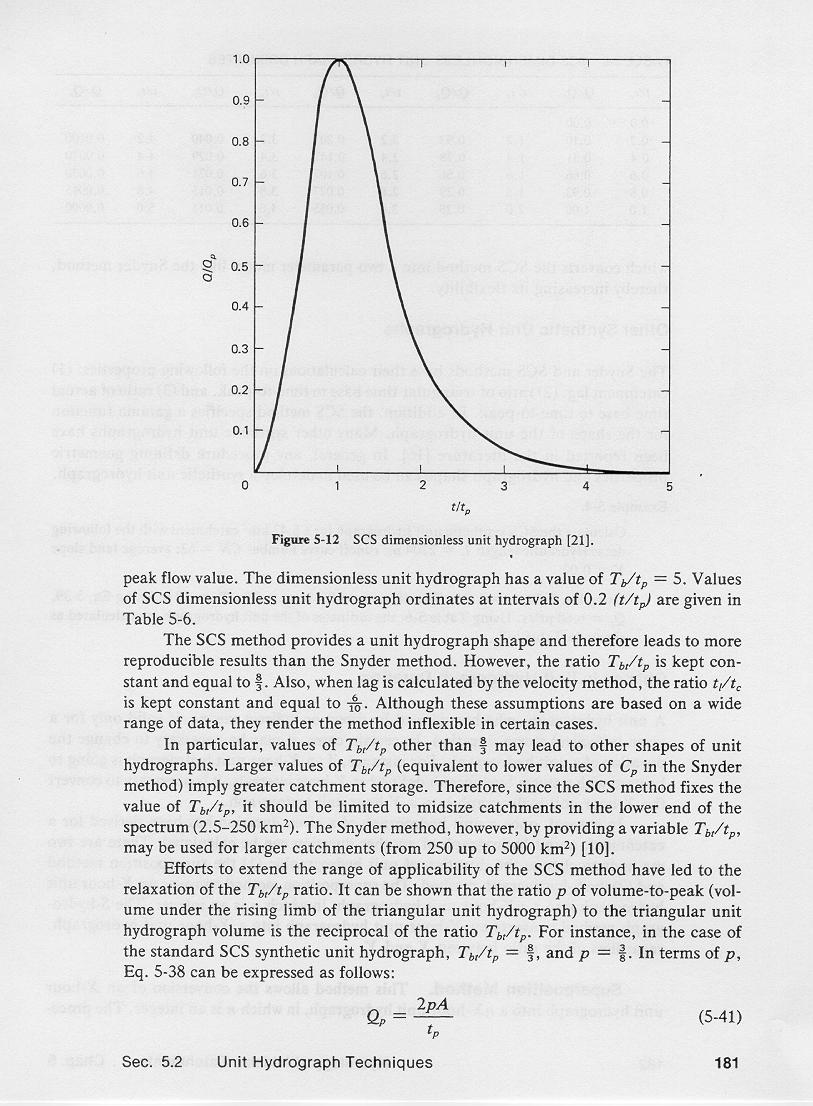
Unlike the Snyder method, the NRCS method specifies a constant ratio of actual time base to time to peak equal to 5:
3.07
3.08
In addition, it specifies a dimensionless unit hydrograph to provide a standard unit hydrograph shape.
3.09

NRCS dimensionless unit hydrograph.
3.10
To calculate catchment lag, that is, the T2 lag, the method uses (1) the curve number method, or (2) the velocity method.
3.11
The curve number method is used for catchments less than 2000 acres, or 8 square kilometers.
3.12
The velocity method is used for larger catchments.
3.13
In the curve number method, the lag is calculated based on catchment length, slope, and curve number.
3.14
In the velocity method, the lag is estimated at 60% of the time of concentration.
3.15
3.16
The ratio of time-to-peak to unit hydrograph duration is fixed at 5:
3.17
3.18
The ratio of time-to-peak to catchment lag is 10/9:
3.19
3.20
The ratio of unit hydrograph duration to catchment lag is 2/9:
3.21
3.22
The ratio of unit hydrograph duration to time of concentration is 2/15:
3.23
3.24
The unit hydrograph peak flow formula is:
3.25
3.26
In SI units, the peak flow formula is:
3.27
3.28
in which Qp = unit hydrograph peak flow for 1 cm of effective rainfall, in m3/s;
A = catchment area in km2; and tp = time to peak, in hours.
3.29
In U.S. Customary units, the peak flow formula is:
3.30
3.31
in which Qp = unit hydrograph peak flow for 1 inch of effective rainfall, in ft3/s;
A = catchment area in mi2; and tp = time to peak, in hours.
4. COMPARISON
4.01
The NRCS method provides a unit hydrograph shape and, therefore, leads to more reproducible results that the Snyder method.
4.02
However, the ratio of triangular time base to time to peak is fixed at Tbt/tp = 8/3.
4.03
This renders the method inflexible in certain cases.
4.04
In particular, values of triangular time base to time to peak other than 8/3 may lead to other shapes of unit hydrographs.
4.05
Values larger than 8/3 imply greater runoff diffusion and catchment storage.
4.06
Therefore, since the NRCS method fixes the value
Tbt/tp = 8/3, it should be limited to midsize catchments in the lower end of the spectrum,
from 1 to 100 sq mi, or 2.5 to 250 sq km.
4.07
The Snyder method can be used with larger values of triangular time base to time to peak, meaning greater runoff
diffusion and catchment storage.
4.08
Thus, the applicability of the Snyder unit hydrograph is extended to midsize catchments in the upper end of the spectrum,
from 100 sq mi to 2000 sq mi (250 to 5000 sq km).
5. PEAK RATE FACTOR
5.01
The number 2.08 in SI units, and its equivalent 484 in U.S. Customary units,
is known as the peak rate factor PRF of the NRCS unit hydrograph.
5.02
It is the standard peak rate factor, associated with Tbt/tp = 8/3.
5.03
If data warrants it, greater values of Tbt/tp can be considered,
which lead to smaller values of PRF.
5.04
These nonstandard values of PRF are applicable to unusually mild basins,
where low relief can be responsible for substantial amounts of runoff diffusion.
Narrator: Victor M. Ponce
Music: Fernando Oñate
Editor: Flor Pérez
Copyright © 2011
Visualab Productions
All rights reserved
| 

