|
ENGINEERING HYDROLOGY: CHAPTER 057 - TR-55 METHOD
1. GRAPHICAL METHOD
1.01
The TR-55 method for flood discharge calculations in small and midsize urban catchments was developed by the
Natural Resources Conservation Service in 1975, and revised in 1986.
1.02
The methodology consists of: (1) graphical method, and (2) tabular method.
1.03
The graphical method is described here.
1.04
This method applies to catchments with time of concentration in the range 0.1 hr to 10 hr.
1.05
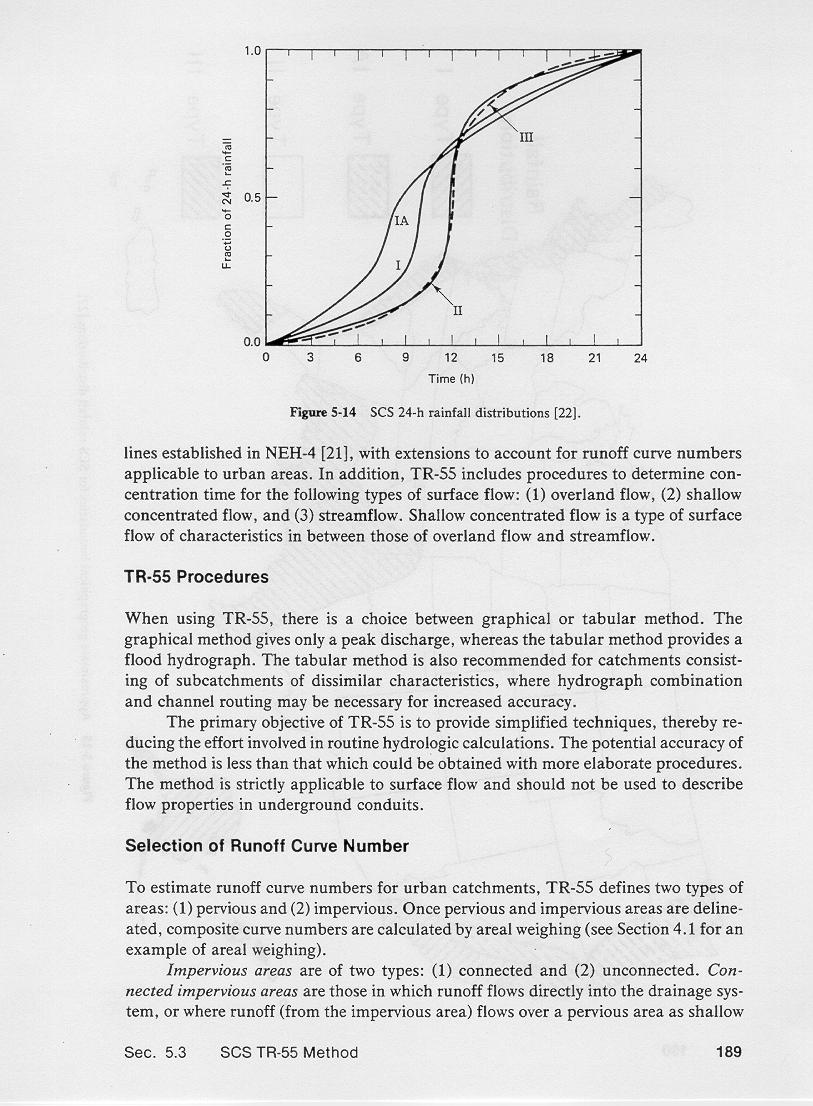
Rainfall is described in terms of total rainfall depth and one of four standard 24-hr temporal rainfall distributions: Type I, Type IA,
Type II, and Type III.
1.06
1.07
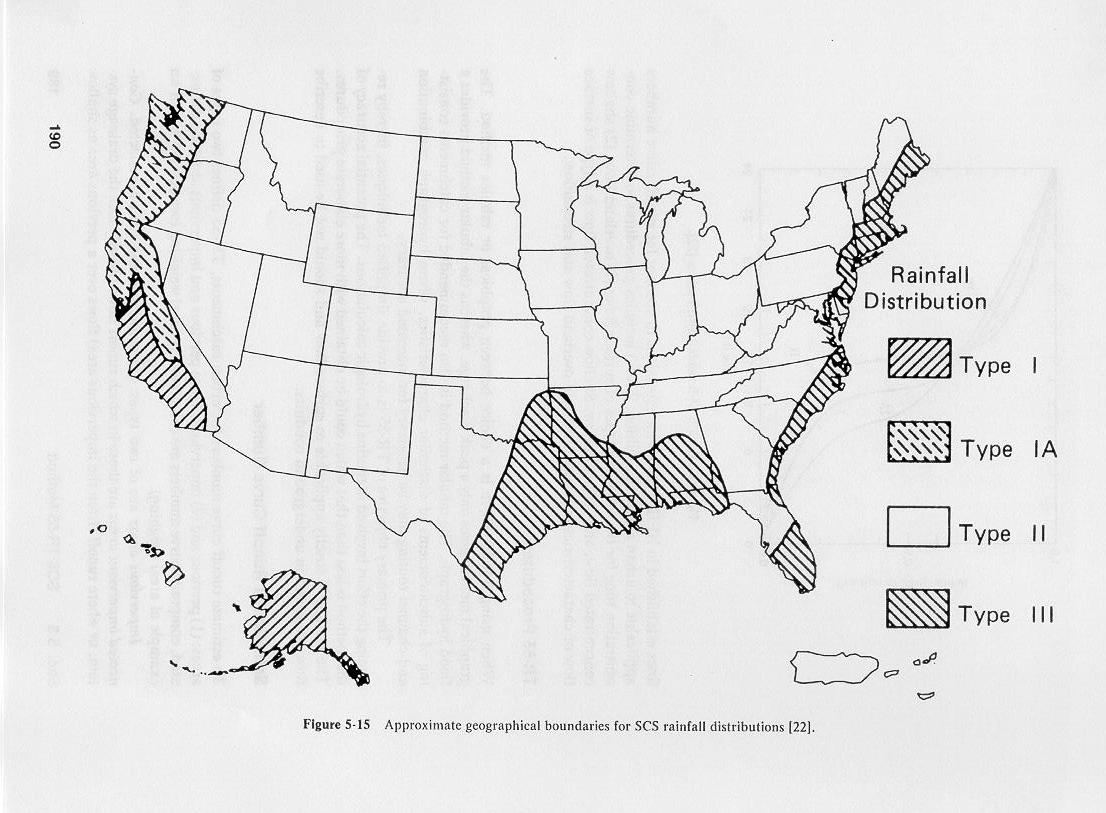
These rainfall distributions are applicable in the United States, as shown here.
1.08
1.09
The duration of 24 hr was selected because most rainfall data is reported on a 24-hr basis.
1.10
Rainfall intensities for shorter durations are contained within the 24-hr distributions.
1.11
For instance, if a 10-yr 24-hr distribution is used, the 1-hr period with the most
intense rainfall corresponds to the 10-yr 1-hr rainfall depth.
1.12
TR-55 uses the curve number method to abstract total rainfall.
1.13
In addition, TR-5 includes procedures to calculate the time of concentration for: (1) overland flow, (2) shallow concentrated flow, and (3) streamflow.
1.14
Shallow concentrated flow is a type of surface flow of characteristics in between those of overland flow and streamflow.
2. SELECTION OF CURVE NUMBER
2.01
TR-55 defines two types of areas: (1) pervious, and (2) impervious.
2.02
Once pervious and impervious areas are defined, and their respective curve numbers identified, composite curve numbers are calculated by area weighing.
2.03
Impervious areas are of two types: (1) connected, and (2) unconnected.
2.04
Connected impervious areas are those in which runoff flows directly into the drainage system, or where runoff, from the impervious area,
flows over a pervious area as shallow concentrated flow.
2.05
Unconnected impervious areas are those in which runoff flows over a pervious area as overland flow.
2.06
Runoff curve numbers for urban areas, for various classes of pervious areas and connected impervious areas, are shown in this table.
2.07
In this table, pervious areas are classified as open space.
2.08
For instance, for fair hydrologic condition and soil group C, the curve number shown in the table is 79.
2.09
For impervious areas, for 1/3-ac residential districts with 30% impervious and hydrologic soil group B, the curve number shown in the table is 72.
2.10
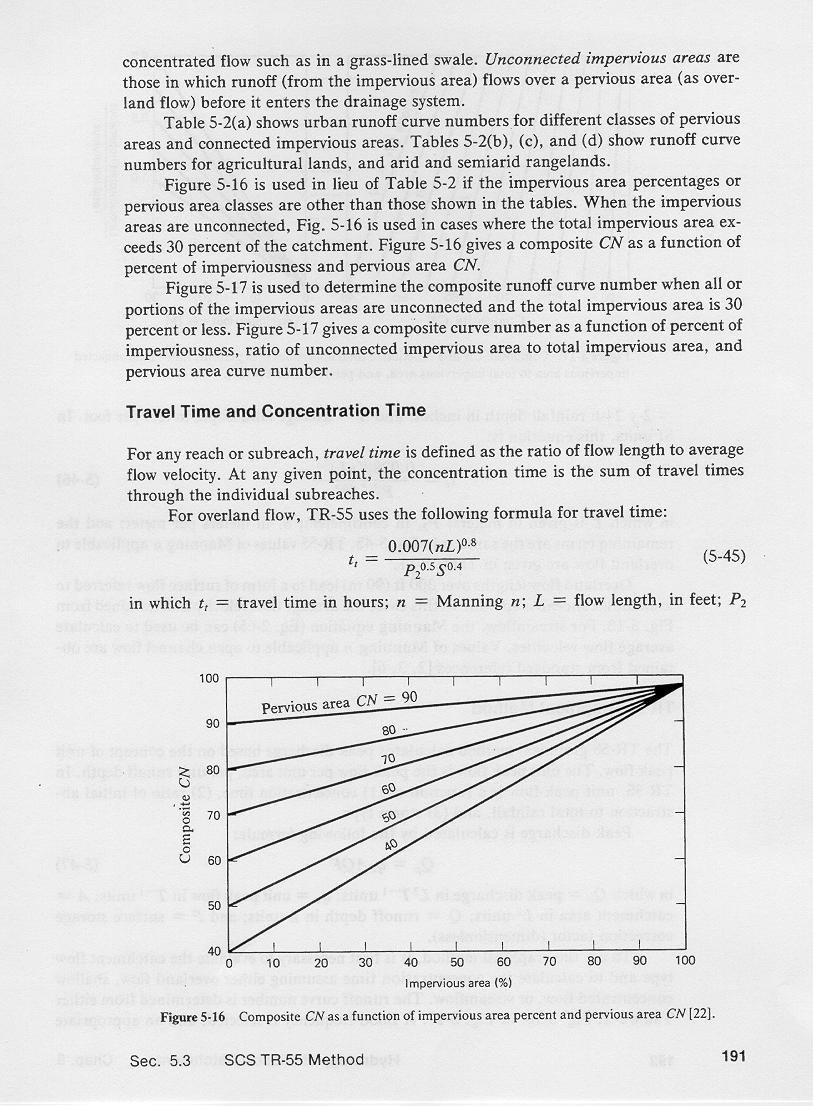
This figure is used to calculate composite curve numbers if the impervious area percentages or the pervious area classes differ from those shown in the table.
2.11
This figure is also used for unconnected impervious areas, when the total impervious area exceeds 30% of the catchment.
2.12
Enter this figure with total impervious area, go up to the line corresponding to the pervious area curve number, and move horizontally to the
left to find the composite curve number.
2.13
2.14
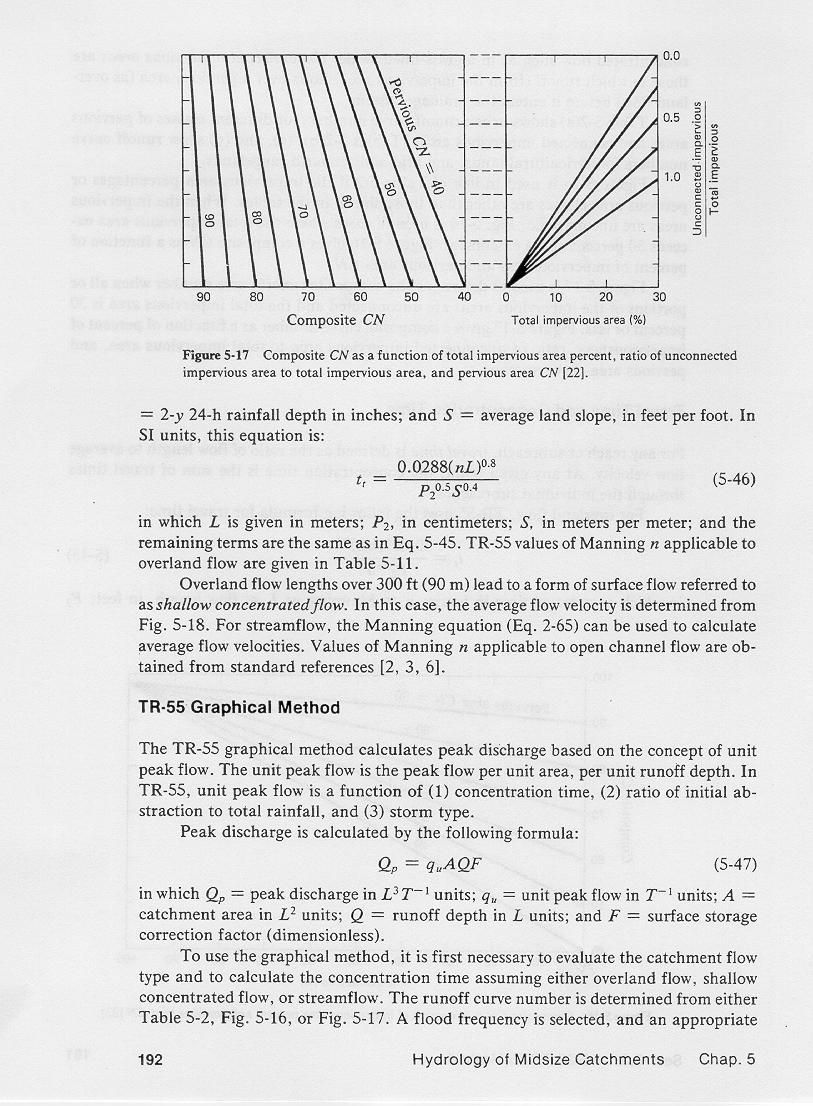
This figure is used to calculate composite curve numbers when all or portions of the impervious areas are unconnected, and the total impervious area is less than or equal to 30%.
2.15
Enter this figure with total impervious area on the bottom right,
go up to the line corresponding the given ratio of unconnected impervious to total impervious, move horizontally to the left graph to the line
corresponding to the pervious curve number, and move down to find the composite curve number.
2.16
3. TRAVEL TIME
3.01
For any subreach, travel time is the ratio of flow length to mean flow velocity.
3.02
The time of concentration is the sum of individual travel times for the subreaches.
3.03
For overland flow, the travel time is:
3.04
0.007 (n L)0.8
P20.5 S0.4
|
3.05
in which tt = travel time in hours;
n = Manning's n;
L = flow length, in feet;
P2 = 2-yr 24-hr rainfall, in inches; and
S = average land slope, in feet per feet.
3.06
In SI units, the travel time equation is:
3.07
0.0288 (n L)0.8
P20.5 S0.4
|
3.08
in which tt = travel time in hours;
n = Manning's n;
L = flow length, in meters;
P2 = 2-yr 24-hr rainfall, in cm; and
S = average land slope, in m/m.
3.09
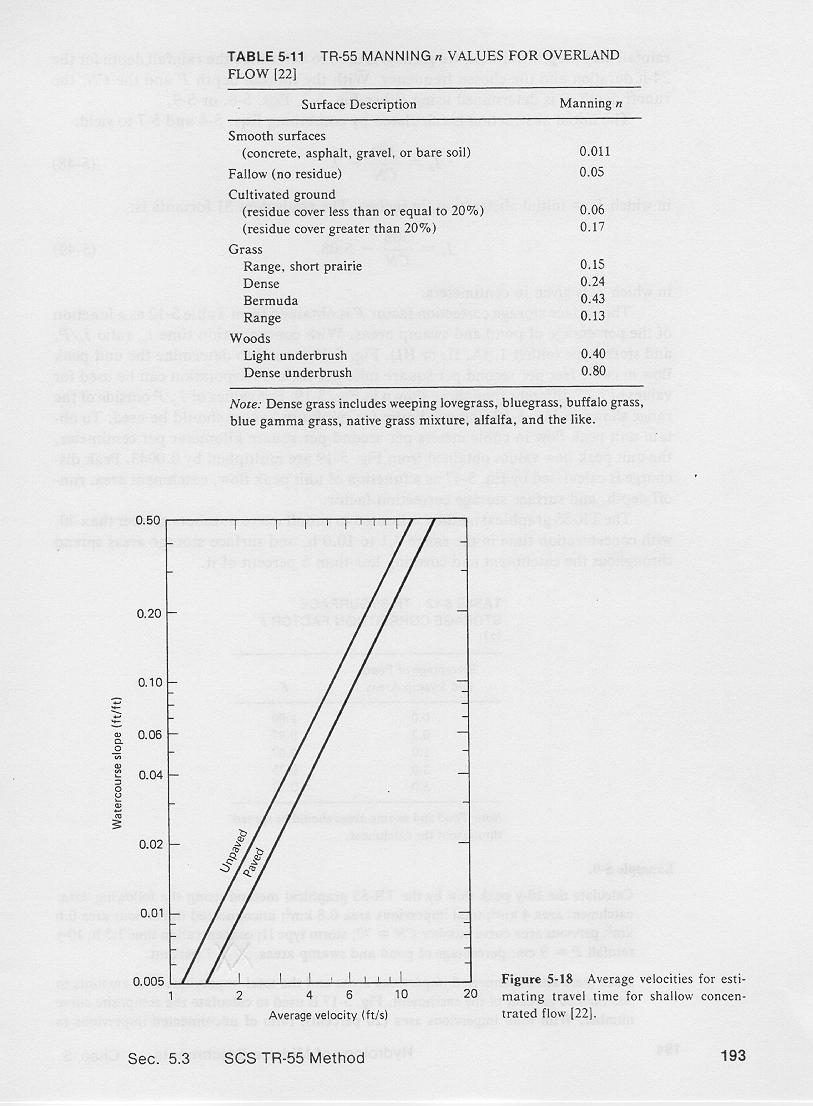
Values of Manning's n applicable to overland flow are shown in this table.
3.10
Note that the values in this table are substantially higher that those of streamflow.
3.11
3.12
Overland flow lengths over 300 ft, or 90 meters, lead to shallow concentrated flow.
3.12
This figure shows the average velocity for shallow concentrated flow, for paved and unpaved surfaces, as a function of watershed slope.
3.13
For streamflow, the Manning equation is used to calculate flow velocities.
3.14
Values of Manning's n applicable to streamflow are given in USGS Water Supply Paper 1849, by Harry Barnes,
and other standard references.
4. TR-55 GRAPHICAL METHOD
4.01
This method calculates peak discharge based on the concept of unit peak flow.
4.02
The unit peak flow is the peak flow, per unit area, per unit of runoff depth.
4.03
In TR-55, the unit peak flow is a function of:
(1) time of concentration,
(2) ratio of initial abstraction to total rainfall, and
(3) storm type.
4.04
Peak discharge is calculated by the following formula:
4.05
4.06
in which:
Qp = peak discharge, in cubic feet per second,
qu = unit peak discharge, in cubic feet per second, per square mile, per inch;
A = catchment area, in square miles;
Q = runoff depth, in inches; and
F = dimensionless surface storage correction factor.
4.07
The steps in the application of the method are the following:
4.08
- Calculate the time of concentration tc, assuming either overland flow, shallow concentrated flow, or streamflow.
- Calculate the curve number CN, or, if necessary, the composite curve number.
- Select a flood frequency, and use depth-duration-frequency data, that is, DDF data, to determine the 24-hr rainfall depth P for the chosen frequency.
4.09
- With P and CN, calculate Q using the curve number equation.
- Calculate the initial abstraction Ia using the applicable formula, in either inches or centimeters.
- Calculate the ratio Ia/P.
4.10
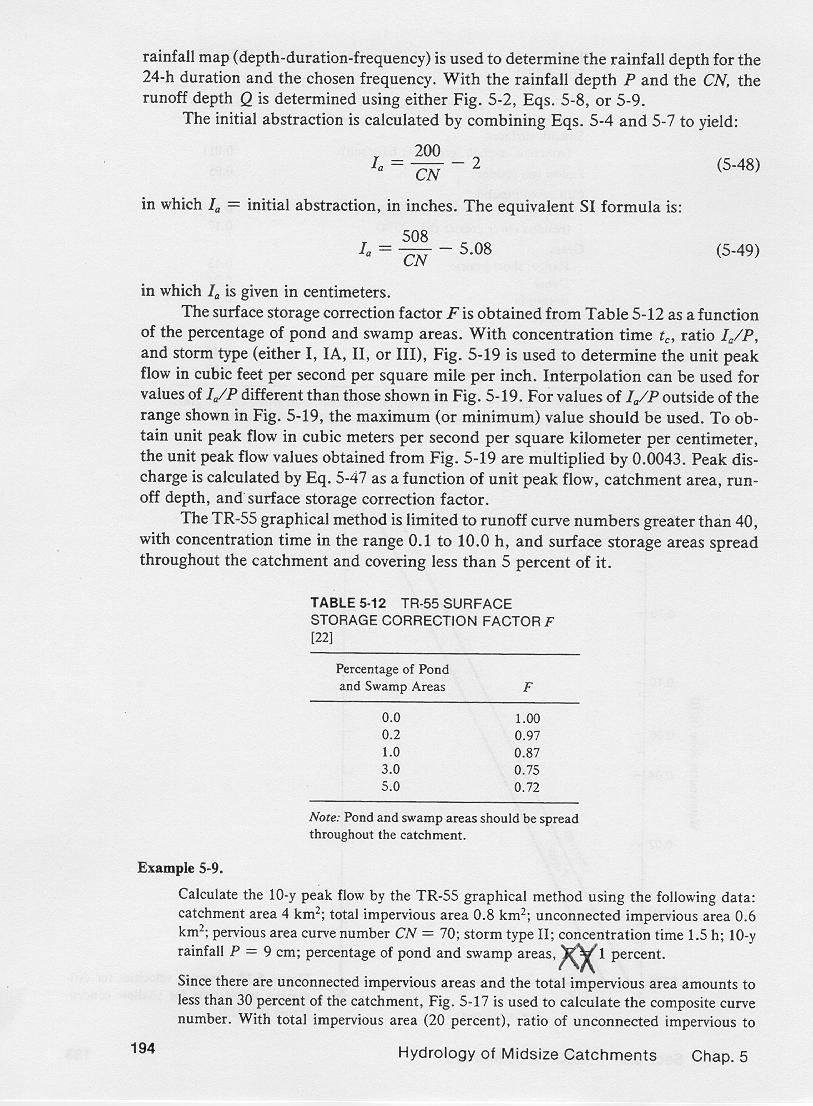
- Determine a surface storage correction factor F as a function of the percentage of pond and swamp areas, the latter varying between 0 and 5%.
- Select a storm type, based on the site's geographical location.
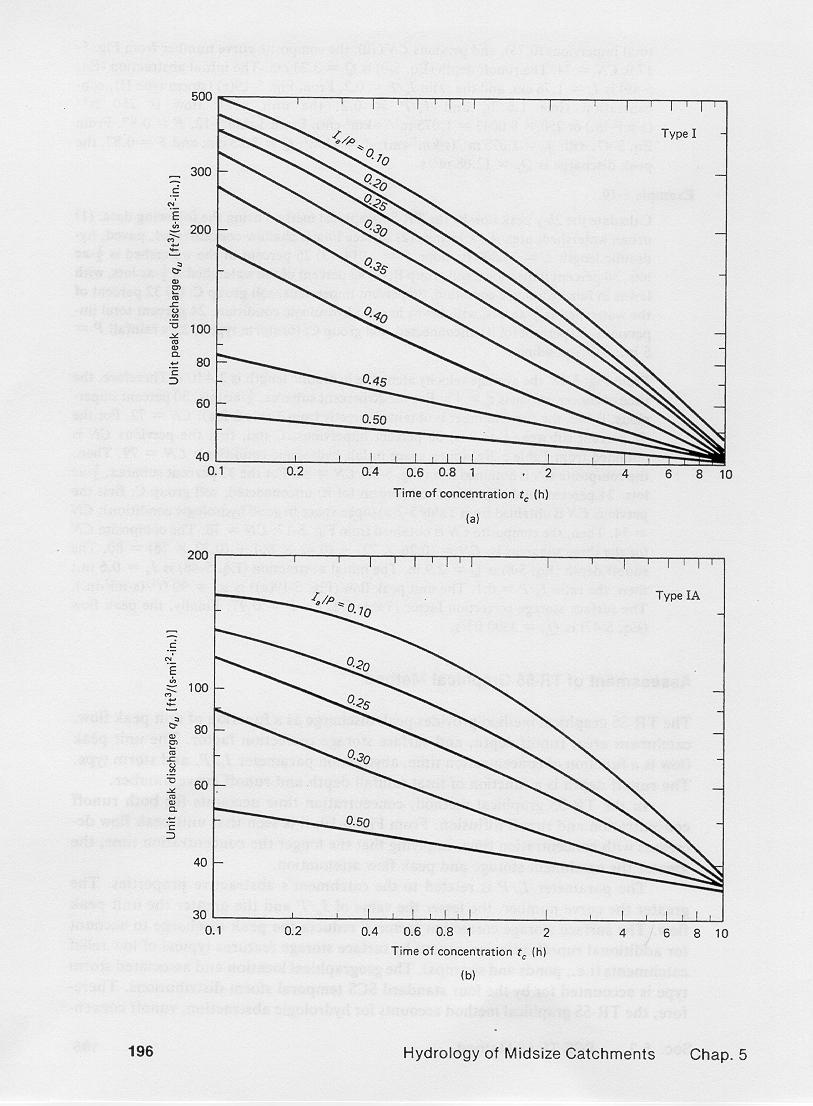
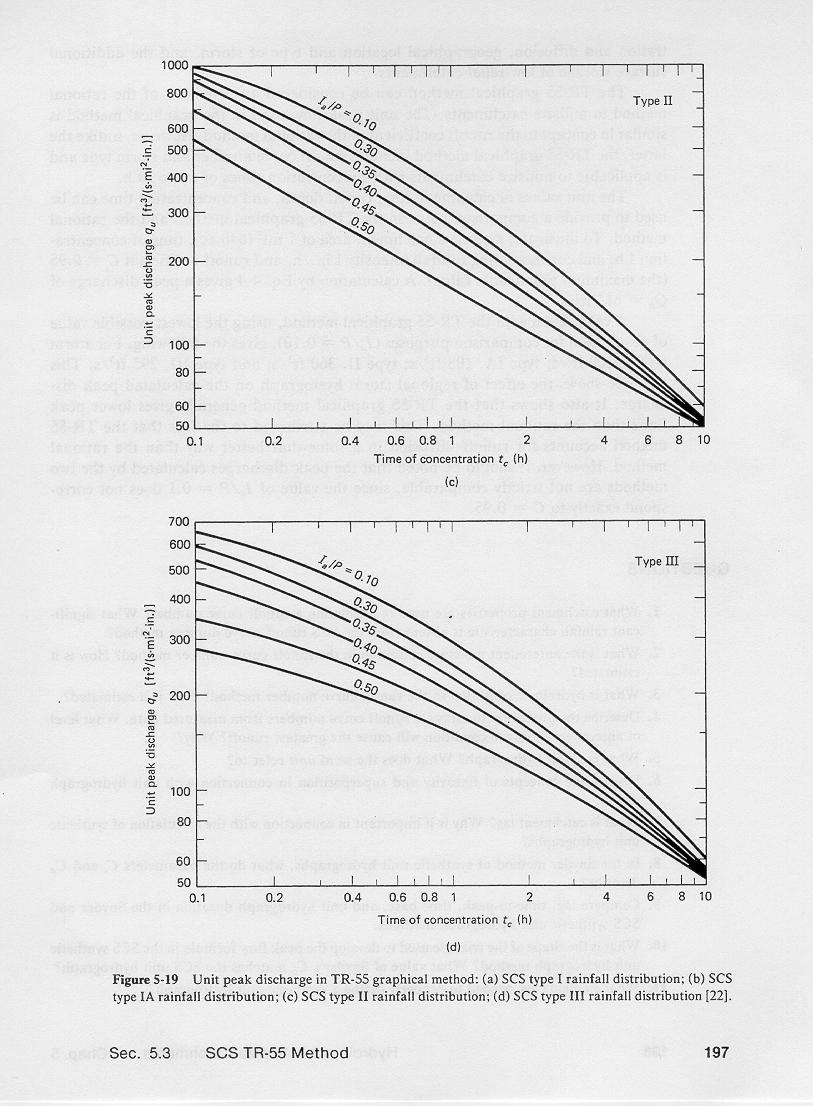
- Based on the chosen storm type, enter one of four graphs to determine the unit width discharge,
based on time of concentration and ratio of initial abstraction to total rainfall.
- Use the formula for peak discharge to determine QP.
4.11
4.12
4.13
4.14
The following are the TR-55 unit-width discharge graphs.
4.15
4.16
4.17
In SI units, to obtain unit peak flow in cubic meters per second, per square kilometer, per centimeter, the figure values are multiplied
by the conversion factor 0.0043.
5. ASSESSMENT
5.01
The TR-55 calculates peak discharge as a function of unit peak flow, catchment area, runoff depth, and surface storage correction factor.
5.02
The unit peak flow is inversely related to the time of concentration; therefore, it accounts for runoff diffusion.
5.03
The TR-55 methodology resembles the Creager curves, albeit with subtantially more detail.
5.04
The larger the curve number, the lesser the ratio of initial astraction to total rainfall, and the greater the unit peak flow.
5.05
The surface storage correction factor reduces the peak discharge to account for additional diffusion caused
by ponds and swamps.
5.06
The geographical location is accounted for by the choice of storm type.
5.07
Thus, the TR-55 method accounts for hydrologic abstraction, runoff concentration and diffusion, geographical location and associated climate,
and the additional surface storage due to the presence of ponds and swamps.
5.08
The TR-55 is properly an extension of the rational method to the realm of the midsize catchment.
5.09
Its applicability to time of concentrations up to 10 hr assures midsize catchment size.
5.10
The structure of the peak discharge equation, while empirical,
bears a close resemblance to the runoff concentration equation Qp = IeA.
5.11
In the TR-55 method, effective intensity Ie
is replaced by the runoff depth Q associated with the 24-hr storm.
5.12
The catchment area A is present in both TR-55 and rational method formulas.
5.13
Thus, in TR-55, unit peak discharge and, secondarily, surface storage correction factor,
account for runoff diffusion.
5.14
Runoff diffusion prevails in midsize catchments.
5.15
Runoff diffusion is not explicitly accounted for in the rational method.
Narrator: Victor M. Ponce
Music: Fernando Oñate
Editor: Flor Pérez
Copyright © 2011
Visualab Productions
All rights reserved
| 


