|
OPENCHANNEL 053: ESTIMATION OF MANNING ROUGHNESS
1. THEORY 1.01 The general theoretical formula for Manning's n is:
Eq. 1
1.02 where R/k is relative roughness, and k is absolute roughness. R is the hydraulic radius. 1.03 The absolute roughness is taken as a representative grain size of the particles forming the channel bed. 1.04 Strickler used the constant 0.0342 in lieu of relative roughness, and the median grain size as the absolute roughness, to give:
Eq. 2
1.05 Williamson plotted the Darcy-Weisbach friction factor as a function of relative roughness to find:
Eq. 3
1.06 From which Chezy C can be calculated:
Eq. 4 1.07 The relation between C and n is:
Eq. 5
1.08 Combining these two equations, and using d84, the grain size for which 84% is finer, as absolute roughness, leads to:
Eq. 6
1.09 This equation is remarkably similar to the Strickler equation.
1.10 This table shows Manning's n values calculated with the Strickler formula.
2. FACTORS 2.01 The factors affecting Manning's roughness are: 1. Surface roughness 2. Vegetation 3. Channel irregularities 4. Channel alignment 5. Obstructions 6. Size and shape of channel 7. Stage and discharge 8. Season 9. Suspended bed material
2.02 According to the Strickler formula, Manning's n varies directly with surface roughness, the larger the roughness, the larger the Manning's n.
Fig. 08 2.03 Vegetation provides additional roughness, retarding the flow, particularly for overbank flows.
Fig. 01 2.04 Natural channels may require seasonal or annual clearance to maintain the channel and keep the Manning's n from increasing. 2.05 Channel irregularities such as sand bars, ridges, canyons, depressions, and holes and humps in the channel bed provide additional friction, increasing the Manning's n.
Fig. 02 2.06 In natural channels, meandering may increase Manning's n by about 30 percent.
Fig. 03 2.07 The presence of obstructions, whether natural or human-induced, increases Manning's n. Log jams and bridge piers increase n.
Fig. 04
Fig. 05 2.08 In shallow channels, relative roughness increases, increasing Manning's n. Conversely, deep channels may have lower values of n.
Fig. 09
Fig. 06 2.09 In natural channels, friction varies with stage and discharge, affecting the value of Manning's n in a roundabout way. 2.10 As stage increases while the flow is inbank, n decreases; as stage goes overbank, n increases; for high flood stages, n decreases. 2.11 In vegetated channels, or in unlined channels where vegetation has become established, Manning's n increases in the growing season and decreases in the dormant season. 2.12 The transport of suspended bed material load and bedload consume additional energy, increasing channel roughness and Manning's n.
Fig. 07 3.01 Manning's can be measured by streamgaging. 3.02 For a given stream and stage, streamgaging seeks to determine the velocity, hydraulic radius, and energy slope, from which Manning's n can be calculated.
Eq. 7
3.03 In practice, streamgaging is limited due to cost and time contraints. 3.04 Therefore, most applications estimate Manning's n based on experience. 3.05 Estimates are based on: 1. Understanding the factors that affect Manning's n. 2. Becoming aquainted with the appearance of channels whose n values are known. 3. Consulting a table of typical n values shown in books and manuals. 4. Consulting pictorial collections that show channels whose n values are known. 3.06 The Barnes book, USGS Water Supply Paper 1849, remains the most comprehensive pictorial collection of Manning's n for natural river channels, covering the range 0.024 to 0.075.
Fig. 10
Fig. 11 3.07 The Barnes pictorial can be found at http://manningsn.sdsu.edu 3.08 The Arcement and Schneider book, USGS Water Supply Paper 2339, is a pictorial of Manning's n for flood plains, for the range 0.1 to 0.2.
Fig. 12 3.09 The flood plain pictorial can be found at http://manningsn2.sdsu.edu 3.10 The lowest possible value of Manning's n is for a laboratory chanel made of acrylic glass. For this case, n = 0.008. 3.11 For concrete lined channels, n varies in the range 0.013 to 0.015. 3.12 For natural stream and river channels, n varies typically in the range 0.025 to 0.075, the smaller values corresponding to the larger rivers. 3.13 For natural flood plains, n varies typically in the range 0.1 to 0.2. 3.14 For shallow flows over dense grass or underbrush, n may vary from 0.4 to 0.8. 3.15 For the Everglades wetland in South Florida, a value of n = 1 has been documented. 3.16 Estimates of Manning's n can be obtained with this formula:
Eq. 8
3.17 where n0 is the basic value for a straight, uniform, smooth channel, n1 is the value added to account for surface irregularities, n2 is the value added to account for variation in channel cross section, n3 is the value added to account for obstructions, n4 is the value added to account for vegetation, and m5 is the correction factor for channel meandering. 3.18 Values of n0 to m5 are shown in these tables.
Fig. 01 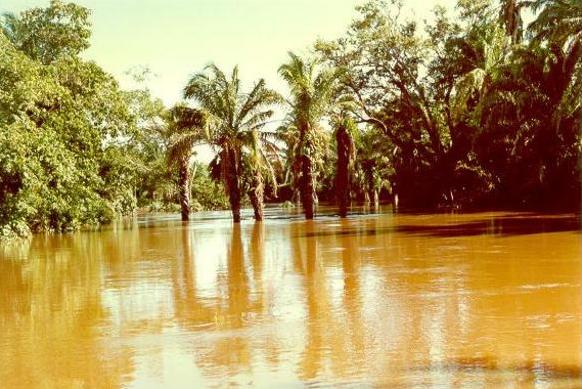 Flood on the Chane river, Santa Cruz, Bolivia.
Fig. 02 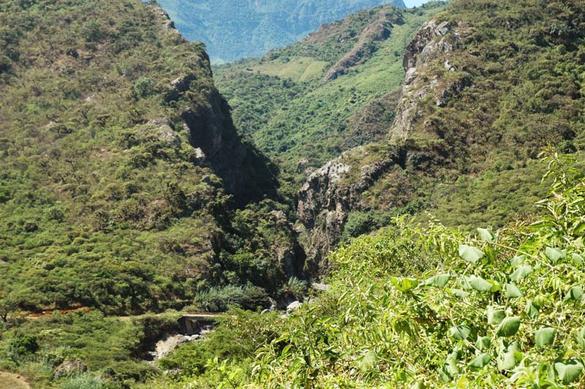 Tocmoche canyon, Cajamarca, Peru.
Fig. 03 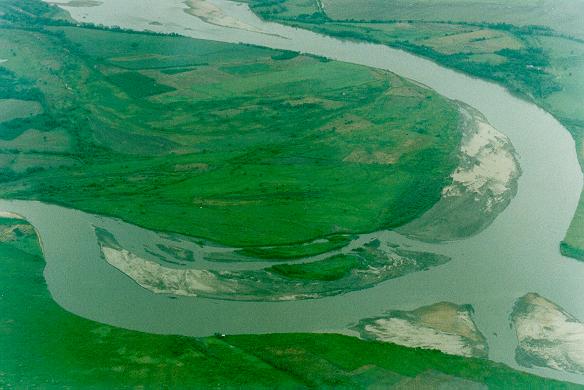 Meta river, Meta, Colombia.
Fig. 04 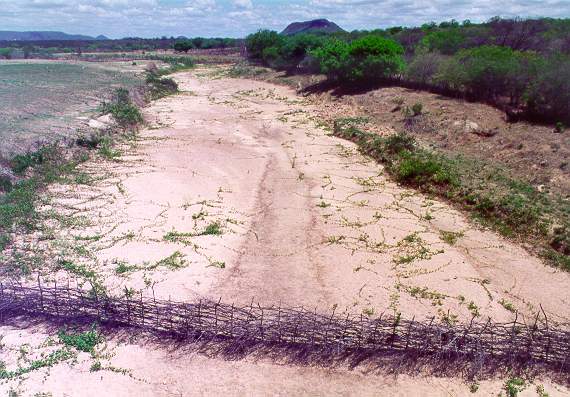 Santo Domingos creek, Pernambuco, Brazil.
Fig. 05 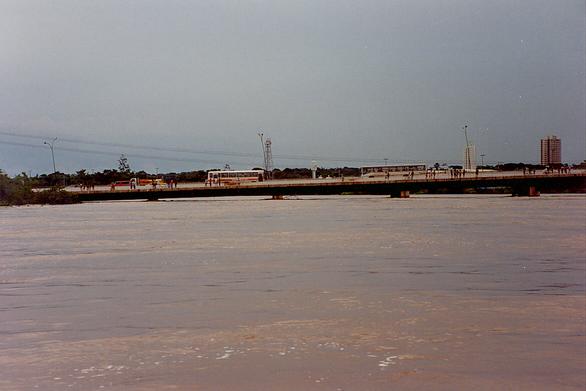 Flood on the Cuiaba river, Mato Grosso, Brazil.
Fig. 06 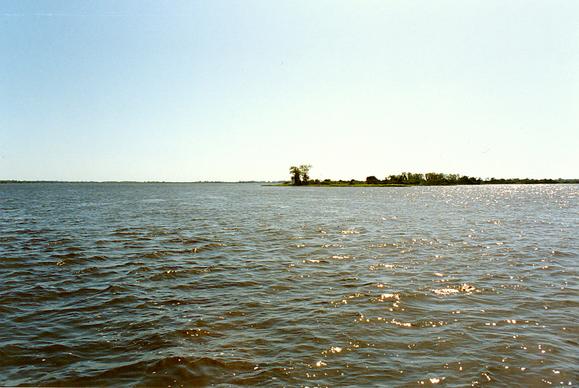 Paraguay river near Porto Murtinho, Mato Grosso do Sul, Brazil.
Fig. 07 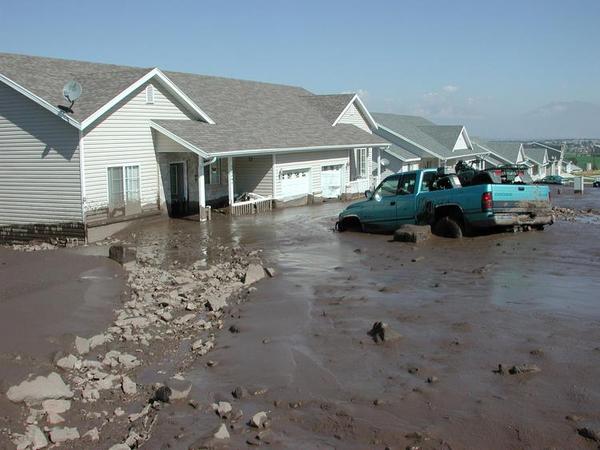 Debris flow at the base of the Wasatch Mountains, Utah.
Fig. 08 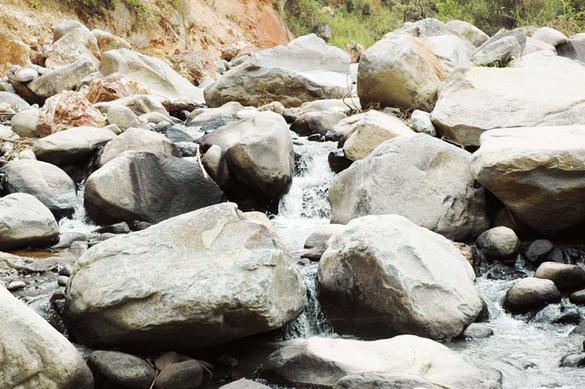 Rachichuela creek, La Leche basin, Lambayeque, Peru.
Fig. 09 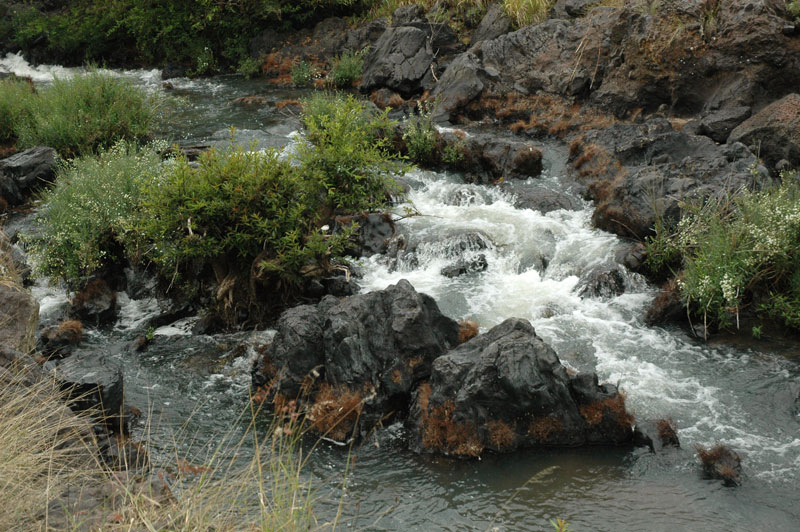 Small stream near Tepic, Nayarit, Mexico.
Fig. 10 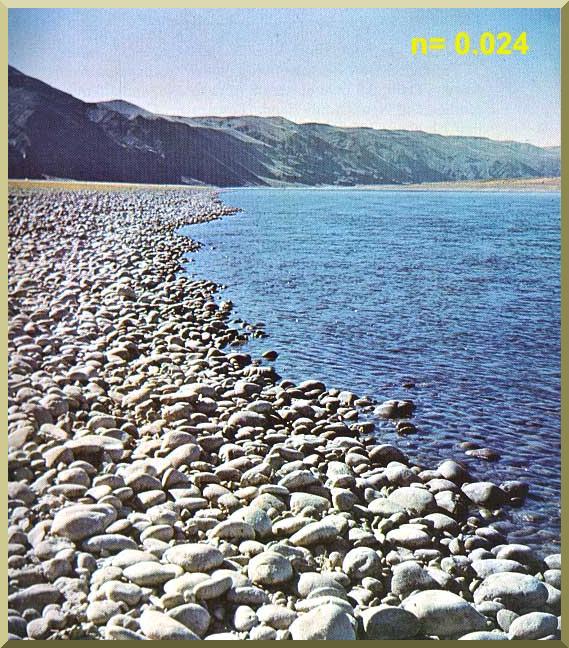 Columbia river at Vernita, Washington: n= 0.024.
Fig. 11 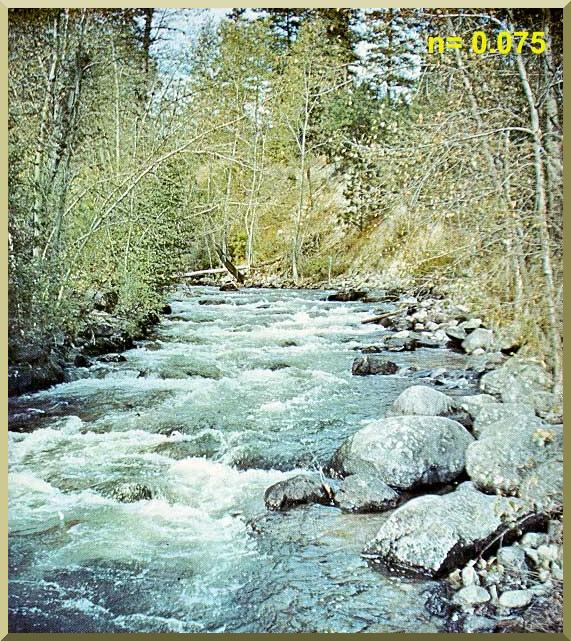 Rock creek near Darby, Montana: n = 0.075.
Fig. 12 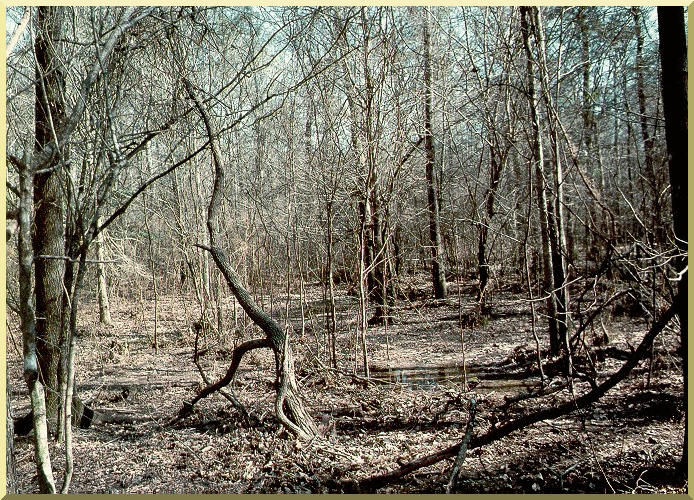 Tenmile creek near Elizabeth, Louisiana: n = 0.15.
Narrator: Victor M. Ponce Music: Fernando Oñate Editor: Flor Pérez
Copyright © 2011 Visualab Productions All rights reserved
|