|
OPEN-CHANNEL HYDRAULICS: LECTURE 072- WATER-SURFACE PROFILES
1. TYPES 1.01 The gradually varied flow equation for hydraulically wide channels is:
Eq. 1
1.02 The sign of the left-hand side is the sign of the depth gradient Sy, since friction is always positive, and therefore, the critical slope Sc is always positive.
1.03 The depth gradient can be positive, zero, or negative.
1.04 A positive depth gradient represents retarded flow, or backwater. A zero depth gradient represents uniform or normal flow. A negative depth gradient represents accelerated flow, or drawdown.
1.05 In the right hand side, the numerator can be positive, zero, or negative. 1.06 A positive numerator represents subnormal flow.
Eq. 2
1.07 A zero numerator represents normal flow.
Eq. 3
1.08 A negative numerator represents supernormal flow.
Eq. 4
1.09 In the right hand side, the denominator can be positive, zero, or negative. 1.10 A positive denominator represents subcritical flow.
Eq. 5
1.11 A zero denominator represents critical flow. In this case, the equation is undefined.
Eq. 6
1.12 A negative denominator represents supercritical flow.
Eq. 7
1.13 A Type I family of water surface profiles is when both numerator and denominator on the right-hand side are positive, that is, a positive depth gradient. This is subnormal/subcritical flow, and the flow is retarded.
1.14 A Type IIA family of water surface profiles is when the numerator is positive and the denominator is negative, that is, a negative depth gradient. This is subnormal/supercritical flow, and the flow is accelerated.
1.15 A Type IIB family of water surface profiles is when the numerator is negative and the denominator is positive, that is, a negative depth gradient. This is supernormal/subcritical flow, and the flow is accelerated.
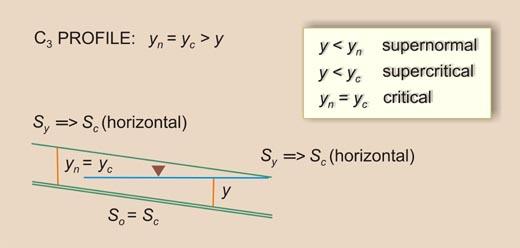
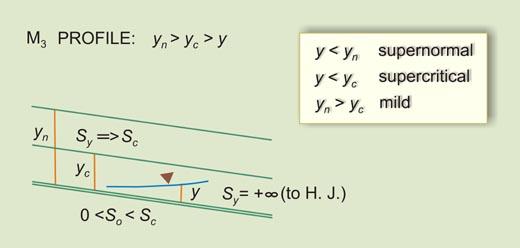
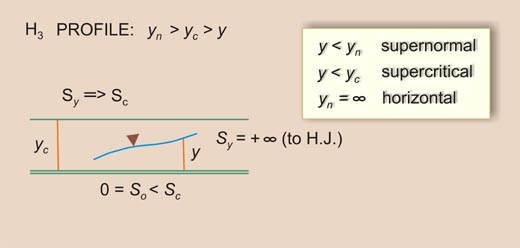
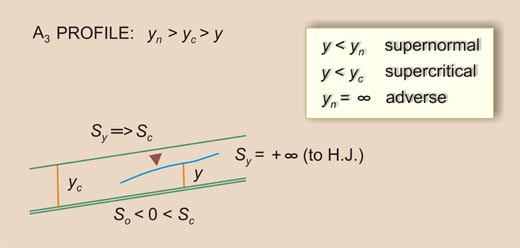
1.16 A Type III family of water surface profiles is when both numerator and denominator on the right-hand side are negative, that is, a positive depth gradient. This is supernormal/supercritical flow, and the flow is retarded.
1.17 The rule for a Type I family of water surface profiles, or subnormal/subcritical family, is:
Eq. 8
1.18 which implies that:
Eq. 9
1.19 which says that the bottom slope can be greater than, equal to, or less than the critical slope.
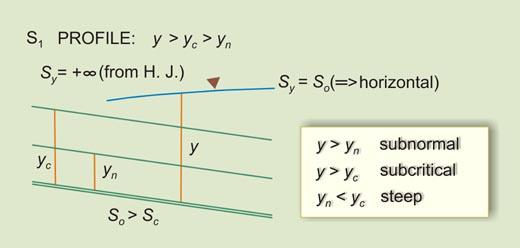
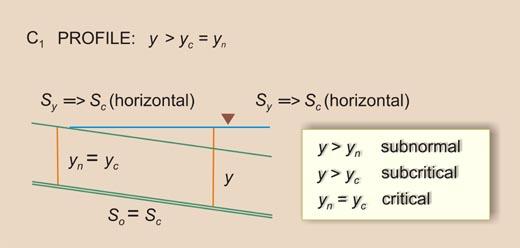
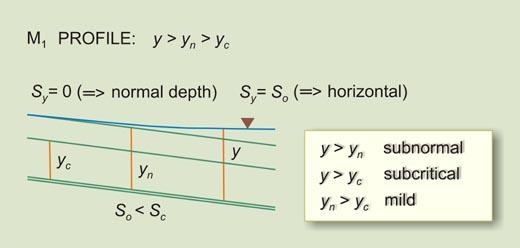
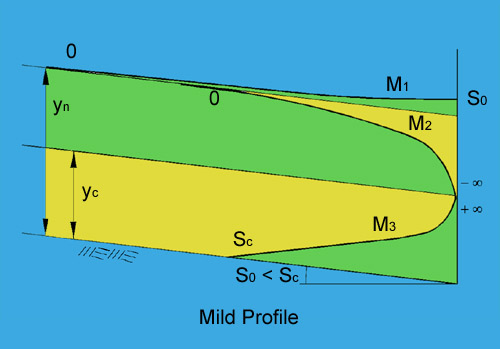
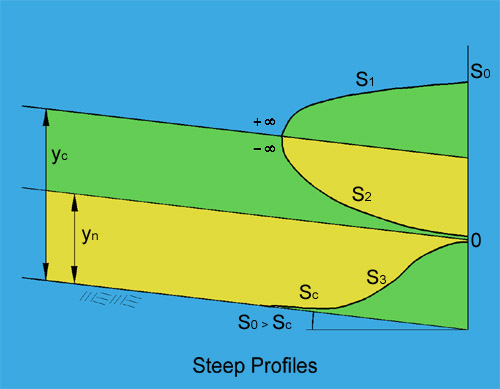
1.20 This gives rise to three water surface profiles: 1. Bottom slope greater than critical slope: S1 profile 2. Bottom slope equal to critical slope: C1 profile 3. Bottom slope less than critical slope: M1 profile
Fig. 01
Fig. 02
Fig. 03
1.21 In a Type I family of profiles, there are no horizontal or adverse profiles, because
Eq. 10
Eq. 11
Eq. 12
1.22 The rule for a Type IIA family of water surface profiles, or subnormal/supercritical family, is:
Eq. 13
1.23 which implies that:
Eq. 14
1.24 which says that the bottom slope is greater than the critical slope.
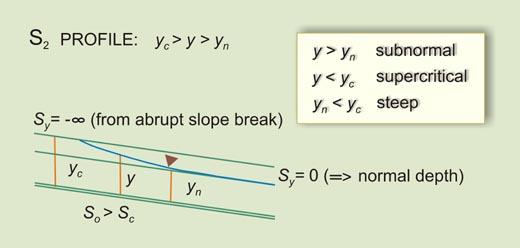
1.25 This gives rise to only one water surface profile: S2 profile
Fig. 04
1.26 In a Type IIA family of profiles, there are no horizontal or adverse profiles, because
Eq. 15
Eq. 16
Eq. 17
1.27 The rule for a Type IIB family of water surface profiles, or supernormal/subcritical family, is:
Eq. 18
1.28 which implies that:
Eq. 19
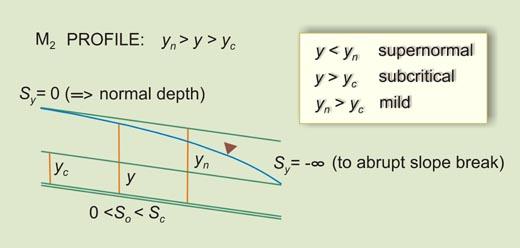
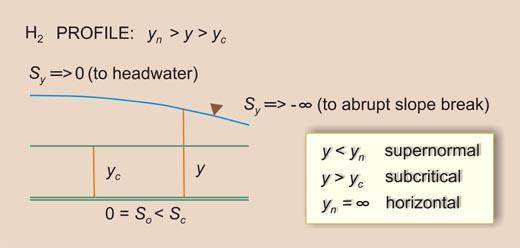
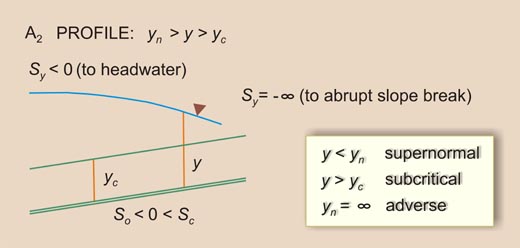
1.29 This gives rise to three water surface profiles: 1. Bottom slope less than critical slope, and positive: M2 profile 2. Bottom slope less than critical slope, and zero: H2 profile 3. Bottom slope less than critical slope, and negative: A2 profile
Fig. 05
Fig. 06
Fig. 07
1.30 The rule for a Type III family of water surface profiles, or supernormal/supercritical family, is:
Eq. 20
1.31 which implies that:
Eq. 21
Eq. 22
1.32 which says that the bottom slope can be greater than, equal to, or less than the critical slope, and equal to or less than zero.
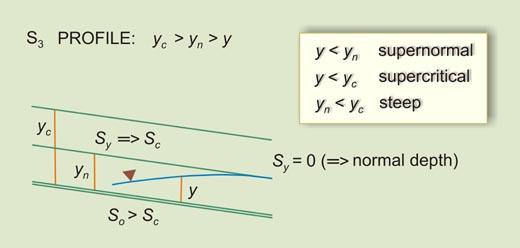
1.33 This gives rise to five water surface profiles: 1. Bottom slope greater than critical slope: S3 profile 2. Bottom slope equal to critical slope: C3 profile 3. Bottom slope less than critical slope but greater than zero: M3 profile 4. Bottom slope equal to zero: H3 profile 5. Bottom slope less than zero: A3 profile
Fig. 08
Fig. 09
Fig. 10
Fig. 11
Fig. 12
1.34 A summary of types of water surface profiles is shown in this table.
1.35 There is a total of 12 types of water surface profiles, divided into three families. 2. LIMITS 2.01 The limits to the flow depth gradient can be analyzed with the gradually varied flow equation. This provides an improved understanding of the nature of water surface profiles.
Eq. 23
Eq. 24
Eq. 25
Eq. 26 2.02 For uniform flow, Sy = 0, and the equation remains:
Eq. 27
2.03 For gradually varied flow there are only two possible cases: Case I: F2 > 0 Case II: F2 = 0
2.04 In Case IA, So > Sy, and Sc > Sy, leads to:
Eq. 28
2.04 In Case IB, So < Sy, and Sc < Sy, leads to:
Eq. 29
2.05 Therefore, the depth gradient has to be either greater than both bottom slope and critical slope, or less than both. The depth gradient cannot be in between bottom slope and critical slope.
2.06 Case II, F2 = 0, leads to:
Eq. 30
2.07 which depicts the state of no flow, that is, a reservoir.
Eq. 31
Eq. 32
Eq. 33
Fig. 13
3. OCCURRENCE 3.01 The M1 profile occurs in a mild channel, upstream of a reservoir. It is the most common type of water surface profile. 3.02 The M2 profile occurs in a mild channel, inmediately upstream of an abrupt change in grade. 3.03 The M3 occurs in a mild channel, downstream of a steep channel carrying supercritical flow.
Fig. 14
3.04 The S1 profile occurs in a steep channel, upstream of a reservoir.
3.05 The S2 profile occurs in a steep channel, downstream of a mild channel carrying subcritical flow.
3.06 The S3 profile occurs in a steep channel, downstream of a steeper channel carrying supercritical flow.
Fig. 15
4. METHODOLOGIES 4.01 There are two methods to calculate water surface profiles: 1. Direct-step method, and 2. Standard-step method. 4.02 The direct-step method is applicable to prismatic channels, while the standard-step method is applicable to both prismatic and nonprismatic, that is, natural channels. 4.03 The direct-step method can be programmed in a computer. The standard-step method is solved with an established government program such as HEC-RAS. 4.04 A comparison of methods is shown here.
Fig. 01
Fig. 02
Fig. 03
Fig. 04
Fig. 05
Fig. 06
Fig. 07
Fig. 08
Fig. 09
Fig. 10
Fig. 11
Fig. 12
Fig. 13
Fig. 14
Fig. 15
Narrator: Victor M. Ponce Music: Fernando Oñate Editor: Flor Pérez
Copyright © 2011 Visualab Productions All rights reserved
|
