|
OPEN-CHANNEL HYDRAULICS: LECTURE 091 - RAPIDLY VARIED FLOW
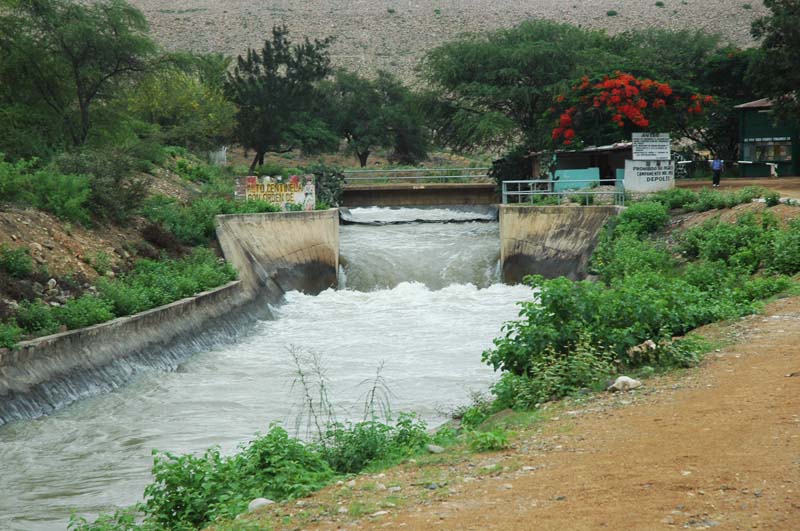
1. FEATURES 1.01 Rapidly varied flow has the following characteristics or features: 1. The curvature of the flow is such that the pressure distribution is not hydrostatic. Fig. 01
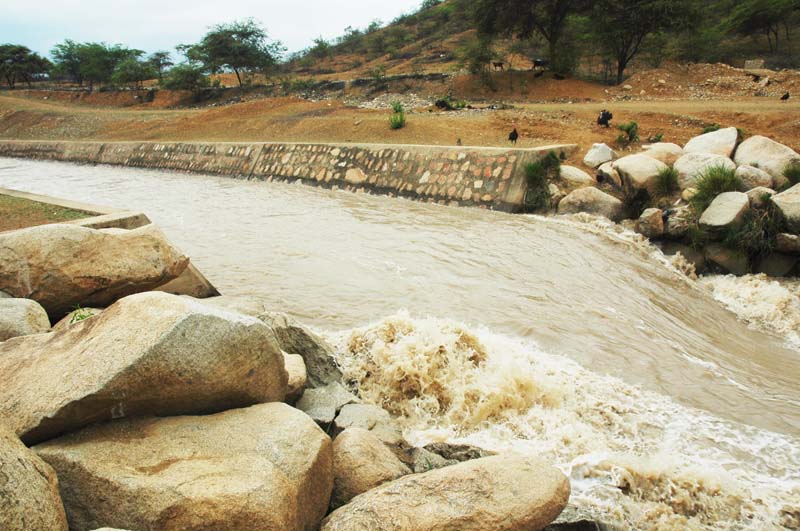
2. The flow variation takes place within a relatively short reach. 3. The frictional force is small compared to the other forces acting. 4. The physical characteristics of the flow are fixed by the rigid boundary geometry. 5. The velocity distribution coefficients are much greater than 1 and cannot be determined accurately. 6. Separation zones, eddies, and rollers tend to complicate the flow pattern, which becomes distinctly three-dimensional. Fig. 02
1.02 A satisfactory solution for rapidly varied flow does not exist. 1.03 Empirical solutions are used in the absence of theory.
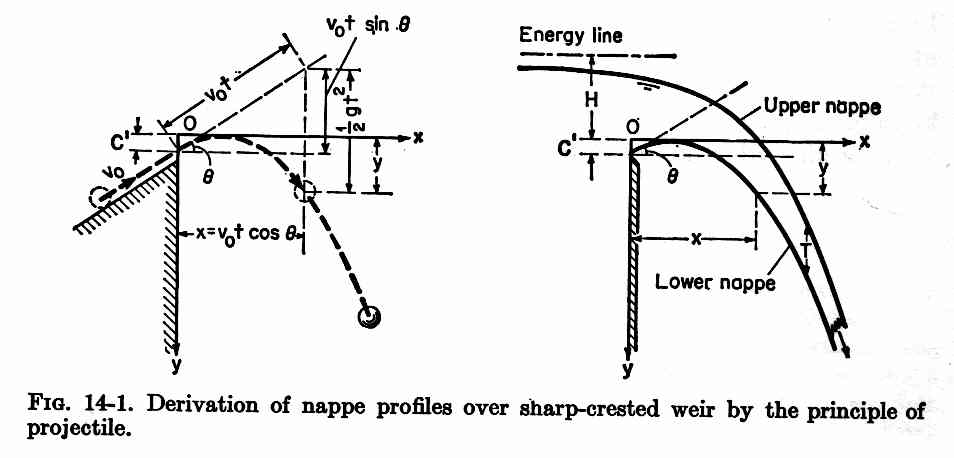
2. SHARP-CRESTED WEIR 2.01 The sharp-crested weir is the simplest form of overflow spillway. 2.02 The shape of the flow nappe over a sharp-crested weir can be interpreted by the principle of the projectile. Fig. 03
2.03 It is assumed that the horizontal velocity component is constant; thus, the only force acting on the nappe is gravity. 2.04 Kinematics leads to a parabolic equation for the nappe surface:
Eq. 1 2.05 With the coefficients:
Eq. 2
Eq. 3
Eq. 4 2.06 The shape of the flow nappe over a sharp-crested weir is useful in the design of overflow spillways. Fig. 14
3. BROAD-CRESTED WEIR 3.01 The broad-crested weir equation is:
Eq. 5
3.02 in which Qd is the design discharge, Cd is the discharge coefficient, L is the weir or spillway length, and Hd is the design head above the crest of the weir, excluding the velocity head.
3.03 Theoretical values of Cd, assuming critical flow in the vicinity of the weir crest, are 1.7 for SI units, and 3.09 for U.S. Customary units. 3.04 Actual values vary with the shape of the weir crest and the roughness of the boundary, and they are typically less than the theoretical value. 3.05 Values varying between 80 to 85 percent of the theoretical value are in common use. Fig. 06
Fig. 07
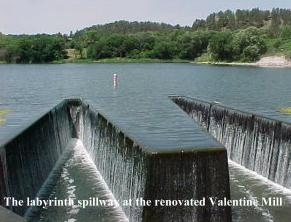
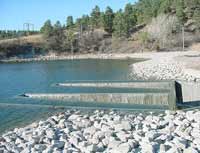
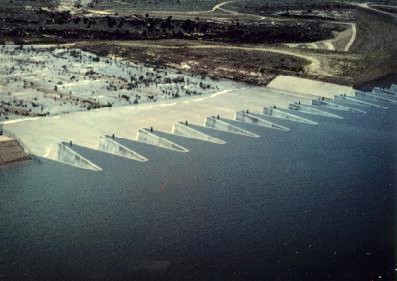
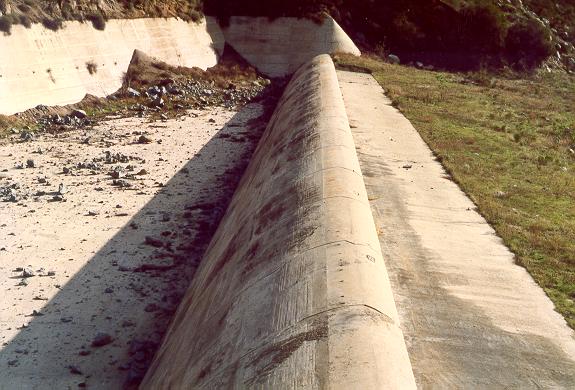
3.06 Efforts to increase weir discharge, while keeping the head constant, have led to the concept of labyrinth spillway. 3.07 A labyrinth spillway increases the effective length of the spillway without actually taking any more physical length, as shown in this example. Fig. 04
Fig. 05
3.08 In practice, the labyrinth spillway works for a limited range of heads. 3.09 For very large heads, the labyrinth becomes submerged, and the effective length of the spillway reverts back to the original length. Fig. 08
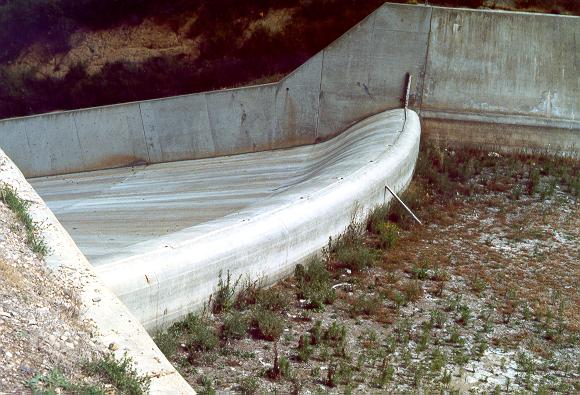
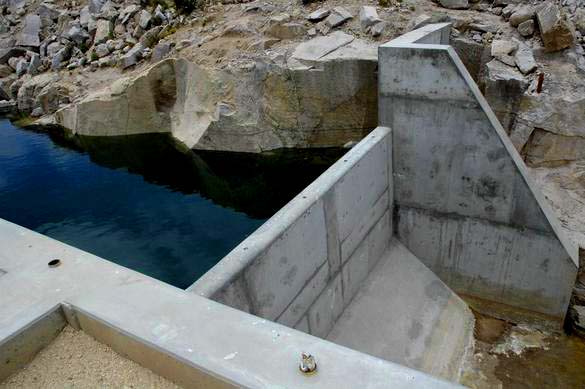
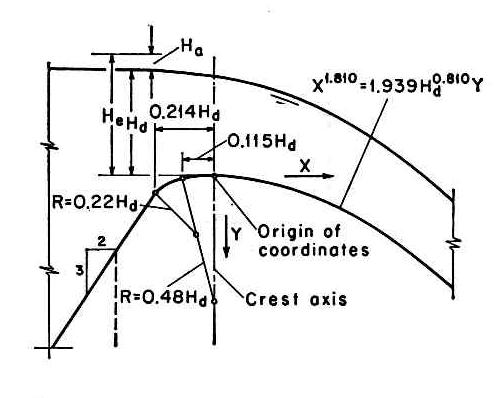
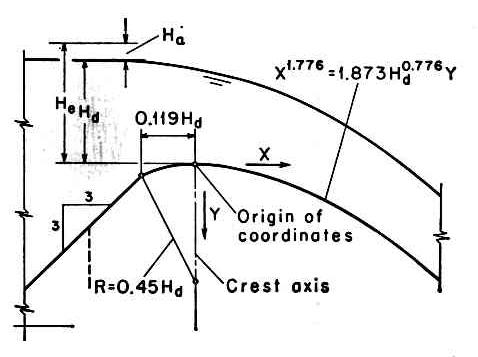
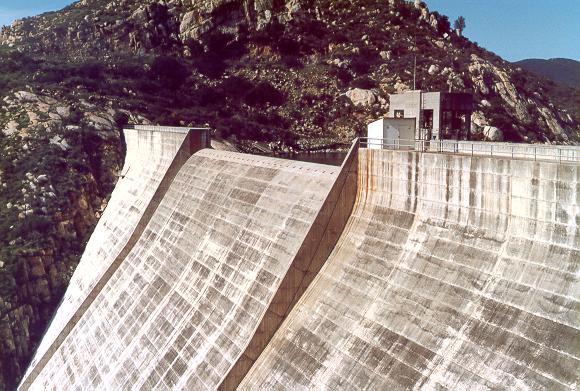
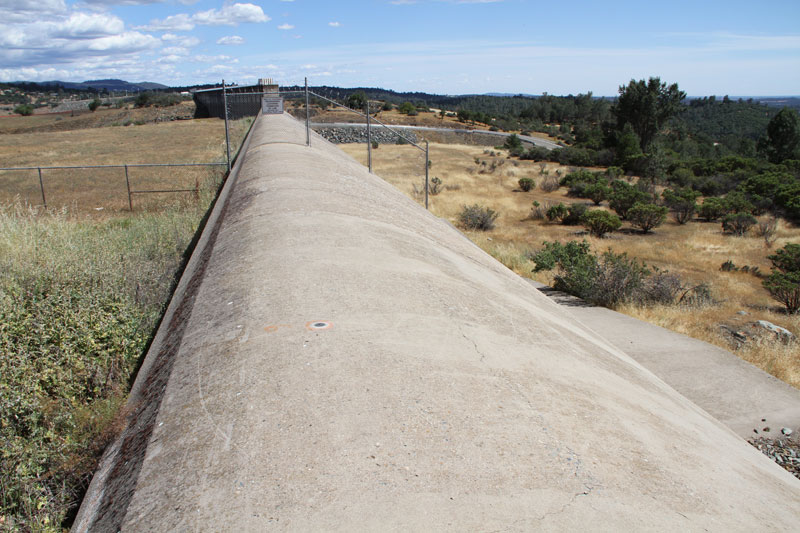
4. OGEE SPILLWAYS 4.01 A Ogee spillway is an overflow weir whose cross-sectional shape matches the underside of the nappe at its upper extremity. Fig. 13
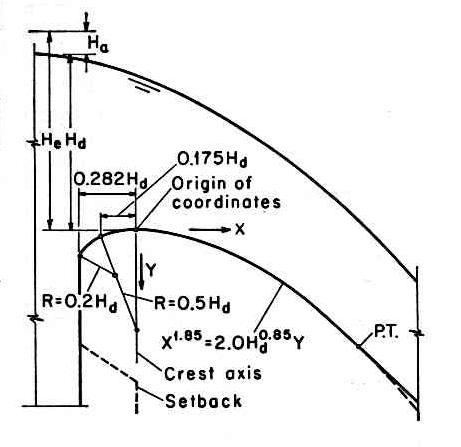
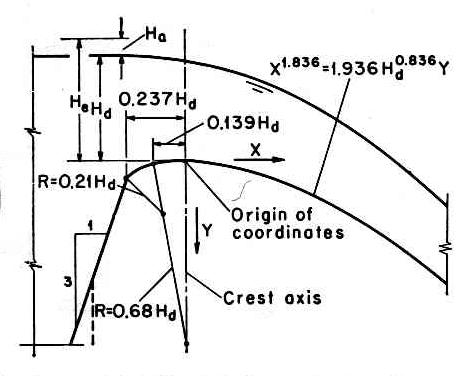
4.02 The U.S. Army Corps of Engineers has developed a series of Ogee spillway sections, collectively referred to as WES standard spillway shapes. Fig. 09
Fig. 10
Fig. 11
Fig. 12
4.03 The equation for the WES spillway shape is:
Eq. 6
4.04 X and Y are the coordinates of the crest profile, with the origin at the spillway crest. 4.05 Hd is the design head excluding the velocity head. 4.06 X and n are parameters that depend on the slope of the upstream face, as shown here.
4.07 For WES shapes, the discharge of the overflow spillway is:
Eq. 7
4.08 where HD is the total head above the spillway crest, including the approach velocity. 4.09 Tests have shown that the effect of the approach velocity is negligible when the ratio of spillway height to design head is greater than 1.33:
Eq. 8 4.10 In this case, the discharge coefficient is 4.03 in U.S. Customary units.
Eq. 9 4.11 This value is 30 percent greater than the theoretical value for a broad-crested weir, 3.09, which implies that the WES spillway shape is very effective in passing the flow.
4.12 For low spillways, the effect of the approach velocity is to reduce the discharge coefficient below the value 4.03.
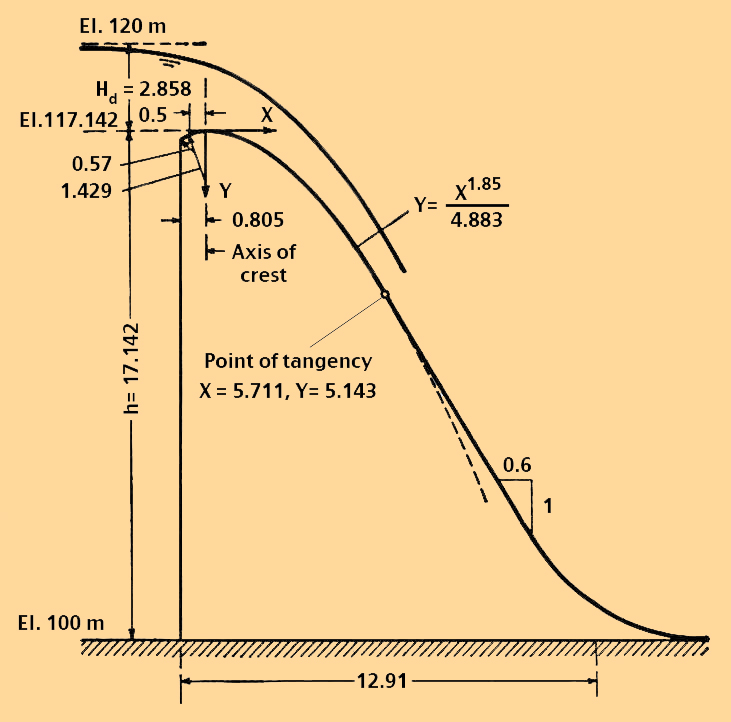
5. EXAMPLE 5.01 Determine the crest elevation of a WES spillway section having a vertical upstream face, with the following hydraulic and geometric data: Fig. 16
Fig. 17
Eq. 10
5.02 The discharge Q is:
Eq. 11
5.03 Solving for total head above the spillway crest:
Eq. 12
5.04 The approach velocity is the design discharge divided by the flow area:
Eq. 13
5.05 The velocity head is:
Eq. 14
5.06 The design head is:
Eq. 15
5.07 The spillway height is:
Eq. 16
5.08 The ratio of spillway height to design head is:
Eq. 17
5.09 Therefore, this is high overflow spillway, and the assumption of discharge coefficient equal to 4.03 was correct.
Eq. 18
5.10 The spillway crest elevation is:
Eq. 19
Fig. 15
5.11 The equation for the spillway shape is:
Eq. 20
5.12 For a vertical spillway face, K = 2, and n = 1.85. With the design head Hd = 2.858 m
Eq. 21
5.13 The equation for the spillway shape is:
Eq. 22
5.14 To calculate the coordinates of the end of the profile on the downstream face of the spillway, at the point of tangency, the derivative is:
Eq. 23
Eq. 24
Eq. 25
5.15 Solving for the X-coordinate of the end of the profile Xo, at the point of tangency:
Eq. 26
5.16 Replacing Xo in the equation for spillway shape:
Eq. 27
6. SPILLWAY RATING 6.01 The spillway profile is designed for one head, the design head. 6.02 For heads lower than the design head, the pressure on the spillway is above atmospheric and lower than hydrostatic. 6.03 For heads higher than the design head, the pressure on the spillway is below atmospheric, and this may lead to flow separation. 6.04 The design head may be exceeded by up to 50 percent; beyond that, harmful cavitation may develop. 6.05 The design head Hd excludes the approach velocity. 6.06 The total head HD includes the approach velocity. 6.07 The spillway rating is based on the theoretical broad-crested weir equation, which assumes critical flow in the vicinity of the weir crest:
Eq. 28
Eq. 29
Eq. 30
Eq. 31
6.08 The actual design discharge is:
Eq. 32
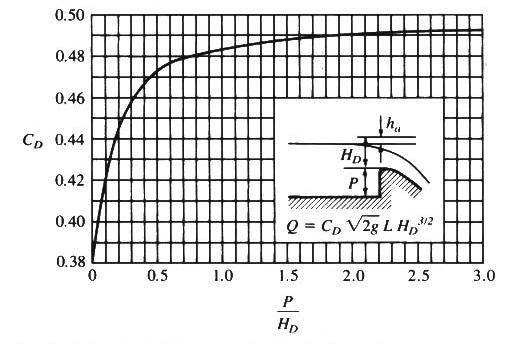
6.09 in which CD is the discharge coefficient applicable to the design discharge, varying with relative spillway height in the range 0.385-0.492 as shown here. The higher values apply for higher spillways. Fig. 18
6.10 Note that the actual discharge coefficient could be up to 28 percent higher than the theoretical value, depending on the height of the spillway. 6.11 For any head, the spillway rating is:
Eq. 33
6.12 where C is a function of H. 6.13 The spillway rating is also:
Eq. 34
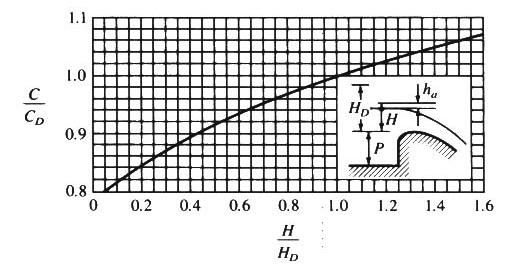
6.14 where the relative discharge coefficient C/CD is a function of relative head H/HD, as shown here. Fig. 19
6.15 A step-by-step procedure to develop a spillway rating is the following: 1. Develop a suitable array of heads H, above spillway crest, from zero up to 50 percent in excess of the design head HD. 2. For each head H, calculate the relative head H/HD. 3. For each relative head H/HD, enter this figure to determine the relative discharge coefficient C/CD. Fig. 19
4. Given the spillway height P, calculate the relative spillway height P/HD and enter this figure to determine the design discharge coefficient CD. Fig. 18
5. For each head H, calculate the actual discharge coefficient C = (C/CD) CD
Eq. 35
6. For each head H, calculate the corresponding discharge Q.
Eq. 36
6.16 As shown here, the discharge coefficient increases with the operating head. Fig. 19
6.17 Therefore, a spillway crest becomes more efficient at heads that exceed the design head. 6.18 However, this apparent advantage comes at the expense of increasing subatmospheric pressures on the spillway, which may lead to cavitation. 6.19 As an example, assume the following spillway data:
Eq. 37
6.20 The results of the spillway rating are summarized in here.
6.21 The results can be confirmed by running http://onlinecalc.sdsu.edu/onlineogeerating.php Fig. 01
Fig. 02
Fig. 03
Fig. 04
Fig. 05
Fig. 06
Fig. 07
Fig. 08
Fig. 09
Fig. 10
Fig. 11
Fig. 12
Fig. 13
Fig. 14
Fig. 15
Fig. 16
Fig. 17
Fig. 18
Fig. 19
Narrator: Victor M. Ponce Music: Fernando Oñate Editor: Flor Pérez
Copyright © 2011 Visualab Productions All rights reserved
|
