|
OPEN-CHANNEL HYDRAULICS: LECTURE 103 - FLOOD ROUTING
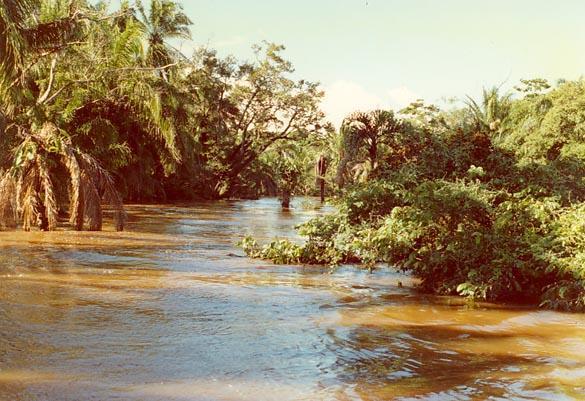
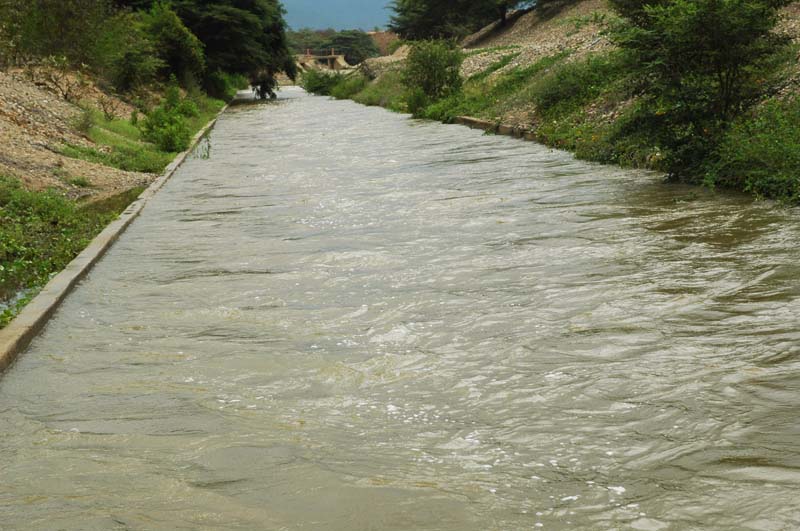
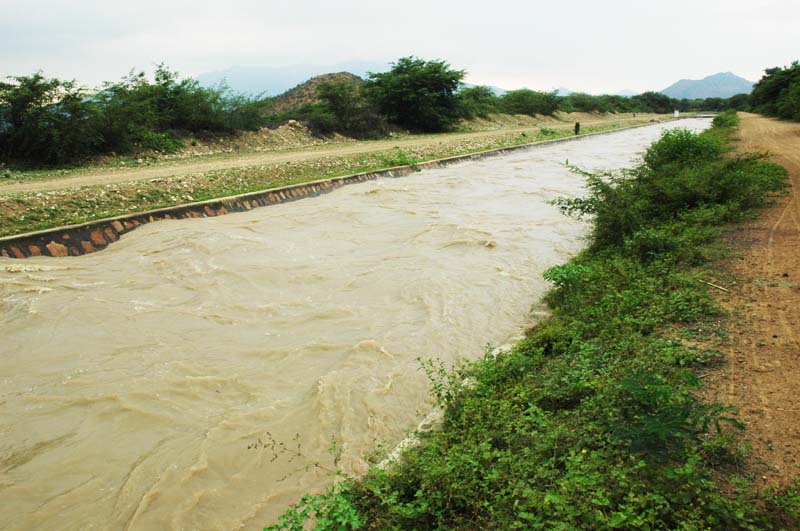
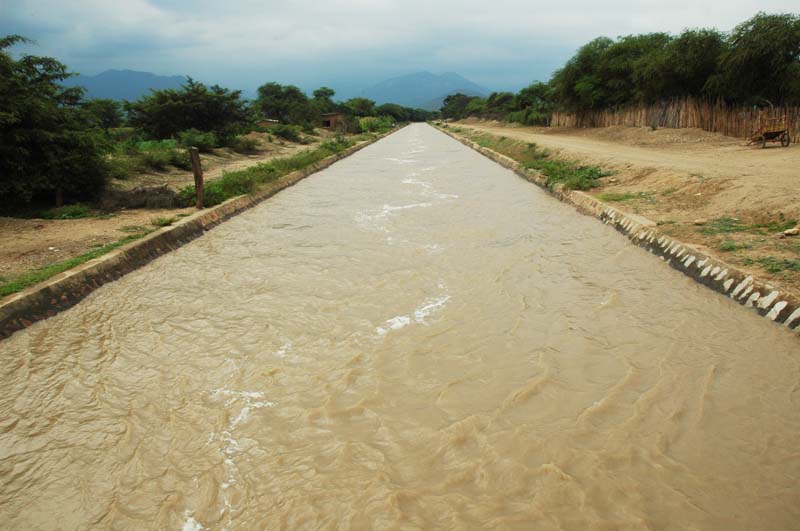
1. KINEMATIC WAVES 1.01 Flood routing is the process of calculating a flood, either for design, forecasting, or hindcasting purposes. Fig. 01
1.02 Flood routing can be applied to kinematic, diffusion, and mixed dynamic waves. 1.03 Routing with kinematic and diffusion waves is described here. 1.04 Kinematic waves are governed by the equation of water continuity and a simplified equation of motion that considers only gravitational and frictional forces. 1.05 The equation of water continuity is:
Eq. 1 1.06 in which u = mean velocity, and h = flow depth. 1.07 In terms of discharge and flow area, the equation of water continuity is:
Eq. 2
1.08 For kinematic waves, the equation of motion is:
Eq. 3
1.09 in which Sf is the friction slope and So is the bottom slope. 1.10 This equation can be expressed as a steady equilibrium rating:
Eq. 4
1.11 Taking the derivative:
Eq. 5
1.12 in which c is the kinematic wave celerity, or Seddon celerity.
1.13 Multiplying the kinematic wave celerity with the water continuity equation and applying the chain rule leads to the kinematic wave equation:
Eq. 6
1.14 Note that the kinematic wave equation is of first order; therefore, it can describe convection, but it cannot describe diffusion.
1.15 This fact has significant implications for flood routing.
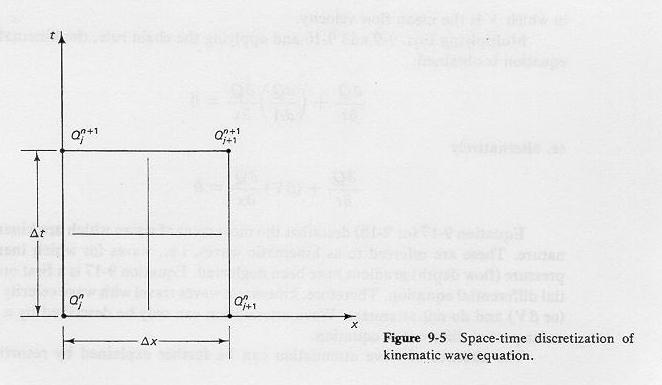
1.16 The numerical solution of the kinematic wave equation on a grid system is a function of the Courant number:
Eq. 7
1.17 in which Δx is the time interval, and Δt is the time interval.
1.18 There are many numerical schemes to solve the kinematic wave equation.
1.19 In practice, the forward-in-time/backward-in-space and forward-in-space/backward-in-time schemes remain the most common.
1.20 A combination of these two schemes is used in the Army Corps of Engineers' HEC-HMS hydrologic model.
1.21 Unfortunately, depending on the prevailing Courant number, these schemes introduce a certain amount of numerical diffusion and dispersion.
1.22 Numerical diffusion and dispersion arise in a numerical computation due to the finite size of the grid.
1.23 Numerical diffusion is a first-order error; numerical dispersion is a second-order error.
1.24 For kinematic wave schemes, the numerical diffusion is arbitrary and not related to the physical diffusion, if any, of the actual wave propagation problem.
1.25 Therefore, a numerical solution of the kinematic wave equation remains essentially a conceptual model, not necessarily related to the actual physics of the phenomena.
2. DIFFUSION WAVES 2.01 Diffusion waves are governed by the equation of water continuity and a simplified equation of motion that considers only gravitational, frictional, and pressure gradient forces. 2.02 For diffusion waves, the equation of motion is:
Eq. 8
Eq. 9
2.03 In the diffusion wave model, the pressure gradient term is responsible for the diffusion effect.
2.04 The combination of water continuity equation and equation of motion of diffusion waves leads to the diffusion wave equation:
Eq. 10
2.05 in which νh is the hydraulic diffusivity, or Hayami diffusivity:
Eq. 11
2.06 qo is the reference unit-width discharge.
2.07 Note that the diffusion wave equation is of second order; therefore, it can describe physical diffusion, unlike the kinematic wave equation, which cannot.
2.08 We conclude that the kinematic wave can describe diffusion only by the introduction of numerical diffusion, while the diffusion wave can describe diffusion on its own, without the need to rely on numerical diffusion.
2.09 In practice, the diffusion wave equation is solved numerically using the Muskingum-Cunge method.
2.10 This method parallels the classical Muskingum method of flood routing.
2.11 However, unlike the Muskingum method, where the parameters are determined by calibration using measured data, in the Muskingum-Cunge method the parameters are estimated based on physical and numerical principles.
3. MUSKINGUM METHOD 3.01 The differential equation of storage is:
Eq. 12 3.02 In the Muskingum method, the relation between inflow, outflow, and storage is:
Eq. 13 3.03 in which K and X are the Muskingum routing parameters. 3.04 The parameter K is a time of storage, and X is a dimensionless weighting factor. 3.05 The substitution of the Muskingum relation into the differential equation of storage leads to the routing equation:
Eq. 14
3.06
Eq. 15
Eq. 16
Eq. 17
3.07
3.08
4. MUSKINGUM-CUNGE METHOD 4.01 The Muskingum-Cunge method is an application of the concept of diffusion wave. 4.02 The method parallels the Muskingum method, but with the significant difference that the routing parameters are determined on a physical and numerical basis. 4.03 The physical characteristics are measurable hydraulic and cross-sectional properties; therefore, there is no need for streamgaging data, and the method can be used in ungaged streams. 4.04
Eq. 18 4.05
Eq. 19
4.05
Eq. 20
4.06
Eq. 21
Eq. 22
Eq. 23 4.07 4.08 4.09 4.10
5.01
Eq. 24
Eq. 25 5.02
Eq. 26 5.03
Eq. 27 5.04
Eq. 28 5.05
Eq. 29 5.06
Eq. 30 5.07
Eq. 31 5.08 The routing computations are shown in this table.
5.09 5.10 5.11 5.12 5.13 5.14 Fig. 01
Fig. 02
Fig. 03
Fig. 04
Fig. 05
Narrator: Victor M. Ponce Music: Fernando Oñate Editor: Flor Pérez
Copyright © 2011 Visualab Productions All rights reserved
|
