|
OPEN-CHANNEL HYDRAULICS: LECTURE 111 - SEDIMENT PROPERTIES
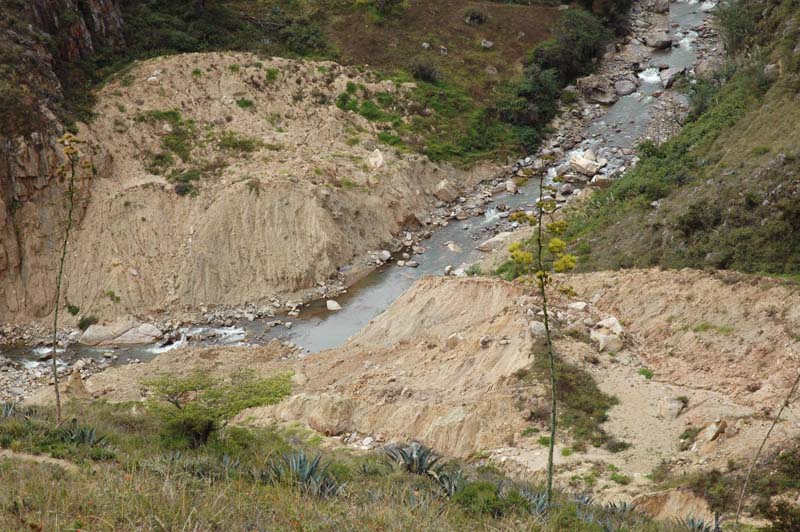
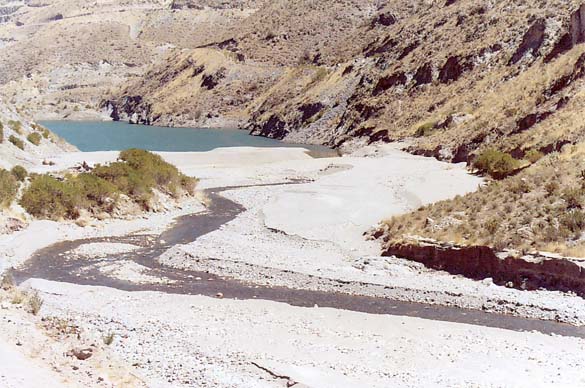
1. SEDIMENT FORMATION 1.01 Sediments are the products of disintegration and decomposition of rocks. 1.02 The disintegration is caused either by large temperature changes or by alternate cycles of freezing and thawing. 1.03 Decomposition refers to the breaking down of mineral components of rocks by chemical reaction. 1.04 Decomposition includes the processes of: (1) carbonation, (2) hydration, (3) oxidation, and (4) solution. 1.05 Carbon dioxide in the atmosphere readily combines with water to form carbonic acid. 1.06 Carbonic acid reacts with feldspars to produce clay minerals, silica, calcite, and other relatively soluble carbonates containing potassium, sodium, iron, and magnesium. 1.07 The addition of water to many of the minerals present in igneous rocks results in the formation of clay minerals such as aluminum silicates. 1.08 Oxidation is accelerated by the presence of moisture in the air. 1.09 Oxygen combines with other elements to form sulfates, carbonates, and nitrates, most of which are relatively soluble. 1.10 Sediment is also generated by slides and mass wasting in steep slopes, under the action of rain and gravity. Fig. 01
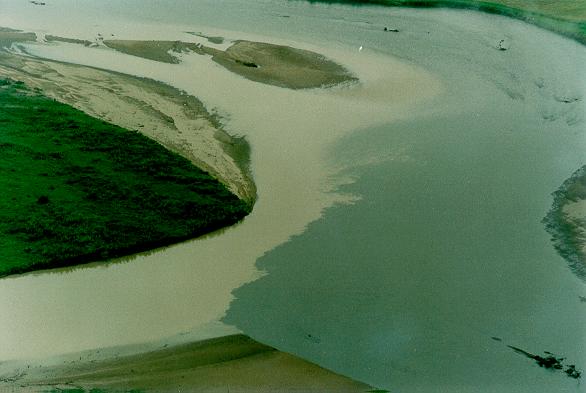
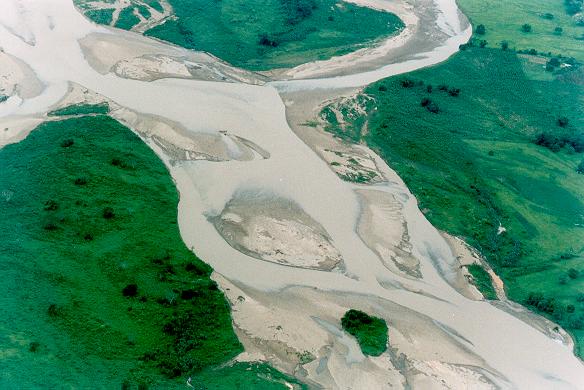
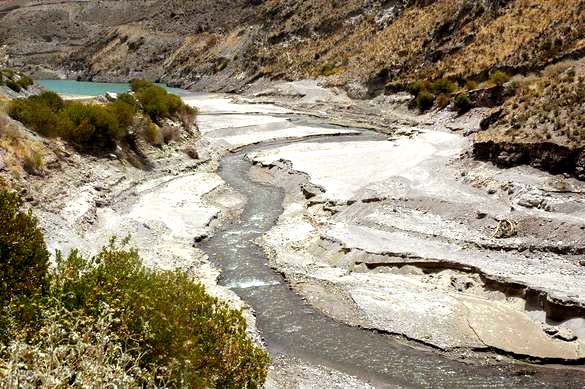
1.12 Sediments are suspended solids, largely governed by the laws of physics. They should be distinguished from dissolved solids. 1.13 Dissolved solids are chemical elements or compounds that are dissolved in water and transported by streamflow. 1.14 All natural streams carry a certain amount of sediments. Normal sediment loads are in the range 200-300 ppm. Sediment-laden rivers may carry more than 1000 ppm. Fig. 08
1.15 The amount of dissolved solids carried by streams in the contiguous United States has been estimated at more than 50% of the amount of suspended solids.
2. PARTICLE CHARACTERISTICS 2.01 The particle characteristics are: 1. Size, 2. Shape, 3. Specific weight, 4. Specific gravity, and 5. Fall velocity. 2.02 A classification of sediments according to size is shown in this table.
2.03 Five groups are included: (1) boulders and cobbles, (2) gravel, (3) sand, (4) silt, and (5) clay. Fig. 09
2.04 A No. 200 sieve is used to separate sand particles from the finer particles such as silt and clay. 2.05 Silt and clay particles are separated by measuring the differences in their rate of fall in still water. 2.06 Particle shape is numerically defined in terms of its sphericity and roundness. 2.07 True sphericity is the ratio of the surface area of a sphere having the same volume as the particle, to the surface area of the particle. 2.08 An alternate definition of sphericity is the ratio of the diameter of the sphere having the same volume as the particle, to the diameter of a sphere circumscribing the particle. 2.09 A sphere has a sphericity of 1, whereas all other shapes have a sphericity of less than 1. 2.10 Roundness is defined as the ratio of the average radius of curvature of the particles edges to the radius of the largest inscribed circle. 2.11 It refers to the sharpness of the edges of sediment particles and is commonly used as an indication of shear strength and particle wear. 2.12 The shape factor is often used as an indicator of particle shape:
Eq. 1 2.13 The quantities a, b, and c are three orthogonal particle length dimensions. 2.14 a is the longest, b is the intermediate, and c is the shortest length dimension. 2.15 Specific weight of a sediment particle is the weight per unit volume. 2.16 Specific gravity of a sediment particle is the ratio of its weight to the weight of an equal volume of water. 2.17 Most sediment particles consists of quartz or feldspar, which are about 2.65 times heavier than water. 2.18 Thus, the specific gravity of sediments is generally considered to be about 2.65. 2.19 Exceptions are heavy minerals, for instance, magnetite, with specific gravity of 5.18, but these occur infrequently. 2.20 The fall velocity of a sediment particle is its terminal rate of settling in still water. 2.21 Fall velocity is a function of size, shape, and specific gravity of the particle, and the specific weight and viscosity of the water. 2.22 For spherical particles, the fall velocity, derived from a balance of submerged weight and drag, can be expressed as follows:
Eq. 2 2.23 in which w = fall velocity g = gravitational acceleration ds = particle diameter CD = dimensionless drag coefficient γs = specific weight of sediment particles γ = specific weight of water. 2.24 The drag coefficient CD is a function of the particle Reynolds number R, defined as
Eq. 3 2.25 in which ν is the kinematic viscosity of the water. 2.26 For particle Reynolds numbers less than 0.1, the drag coefficient CD is equal to 24/R, that is, laminar flow.
Eq. 4 2.27 Substituting the value of CD into the equation of fall velocity leads to Stokes' law:
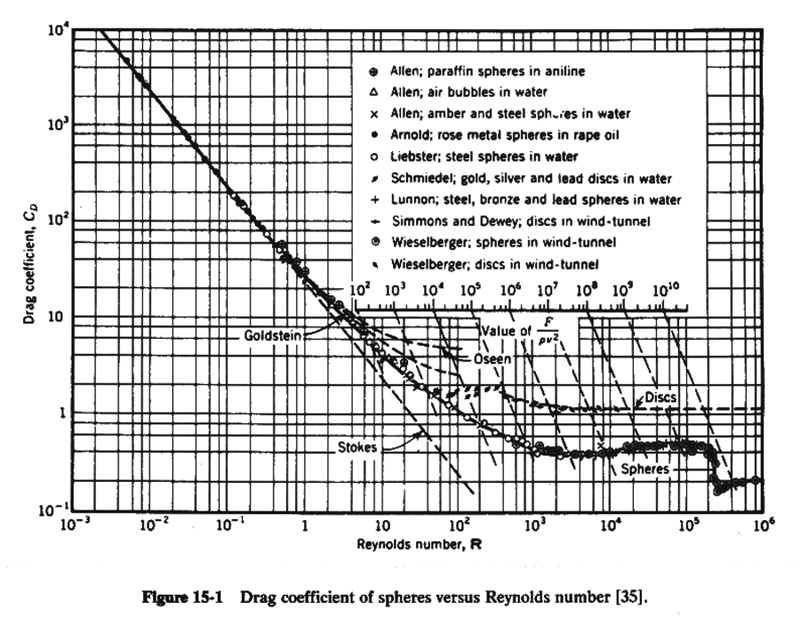
Eq. 5 2.28 For particle Reynolds numbers greater than 0.1, the drag coefficient is still a function of Reynolds number, but the relationship cannot be expressed in analytical form. 2.29 The relationship of drag coefficient versus particle Reynolds number is shown in this figure. Fig. 02
2.30 The iterative procedure to calculate fall velocity is the following: 1. Given the particle diameter ds and water temperature T, assume a particle Reynolds number equal to 100 to start. 2. For the assumed particle Reynolds number, determine the drag coefficient from this figure. 3. Calculate the fall velocity using this equation. 4. Calculate the particle Reynolds number using this equation. 5. Calculate the difference between assumed and calculated particle Reynolds numbers. 6. If the difference is within a specified tolerance, stop and report the fall velocity. 7. Otherwise, replace the assumed with the calculated particle Reynolds number, and return to step 2. 2.31 The procedure is available online at http://onlinecalc.sdsu.edu/onlinefallvelocity.php 2.32 Since fall velocities vary with fluid temperature and viscosity, two particles of the same size, shape, and specific gravity, falling on two different fluids of different viscosity, or in the same fluid at different temperatures, will have different fall velocities. 2.33 To provide a measure of comparison, the concept of standard fall velocity was developed. 2.34 The standard fall velocity of a particle is the average rate of fall that it would attain if falling alone in quiescent water of infinite extent at the temperature of 24 degrees Celsius. 2.33 The standard fall diameter of a particle is the diameter of an equivalent sphere having the same standard fall velocity and specific gravity.
3. SIZE DISTRIBUTION 3.01 Particle size distribution is the key to predicting the behavior of a sediment deposit and estimating its specific weight. 3.02 A sediment sample containing a wide range of particle sizes is poorly sorted. 3.03 A sediment sample containing a narrow range of particle sizes is well sorted. 3.04 The size distribution can be measured in many ways. 3.05 The coarsest fraction can be separated by direct measurement for boulders and cobbles, and by sieving for sands and gravels. 3.06 The Visual Accumulation tube, or VA tube, is a fast, economical, and accurate method of determining the size distribution of sediment samples. 3.07 In the VA tube method, the particles start falling from a common source and become stratified according to their relative settling velocities. Fig. 03
3.08 At a given instant, the particles coming to rest at the bottom of the tube are of a certain sedimentation size, finer than particles than have already settled, and coarser that those still remaining in suspension.
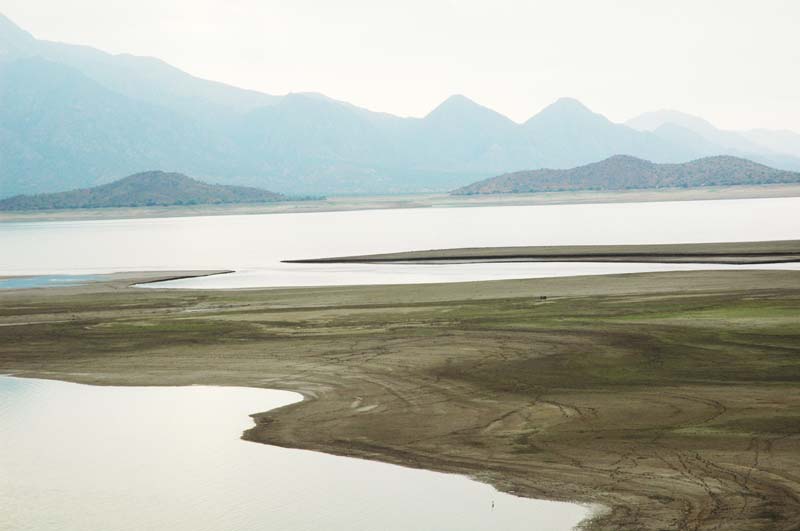
4. SPECIFIC WEIGHT 4.01 The specific weight of a sediment deposit is the dry weight of sedimentary material per unit volume. 4.02 The specific weight of a sediment deposit is always less than the specific weight of the individual particles. 4.03 A knowledge of the specific weight of a sediment deposit allows the conversion of weight to volume. 4.04 In particular, the specific weight of a sediment deposit is useful in studies of reservoir storage depletion by deposition of fluvial sediments. 4.05 The factors influencing the specific weight of a sediment deposit are: 1. Its mechanical composition, 2. The environment in which the deposits are formed, 3. Time. Fig. 04
Fig. 05
4.06 The specific weight of coarse materials such as boulders, gravel and coarse sand changes very little with time. 4.07 However, fine materials such as silts and clays may have initial specific weights that are only a fraction of their ultimate value. 4.08 The Lane and Koelzer relation for specific weight as a function of time is:
Eq. 6 4.09 in which: W = specific weight of a sediment deposit after T years, in lbs per cubic foot, W1 = initial specific weight, measured after 1 year of consolidation, in lbs per cubic foot, and B = a constant. 4.10 This table shows values of W1 and B.
4.11 The procedure is available online at http://onlinecalc.sdsu.edu/onlinelanekoelzer.php 4.12 Drying or aeration of a sediment deposit helps to accelerate consolidation through removal of the water from the pore spaces. Fig. 07
4.13 This table shows the effect of aeration on the specific weight of sediment deposits, in lbs per cubic foot, for several types of soil mixtures. 4.14 Note that the specific weight of sediment deposits can vary from about 2/3 to more than twice the specific weight of water.
Fig. 06
Fig. 01
Fig. 02
Fig. 03
Fig. 04
Fig. 05
Fig. 06
Fig. 07
Fig. 08
Fig. 09
Narrator: Victor M. Ponce Music: Fernando Oñate Editor: Flor Pérez
Copyright © 2011 Visualab Productions All rights reserved
| |||||||||||||||||||||||||||||||||||||||||||||||||||||||||||||||||||||||||||||||||||||||||||||||||||||||||
