|
OPEN-CHANNEL HYDRAULICS: LECTURE 112 - SEDIMENT PRODUCTION
AND YIELD
1. SEDIMENT PRODUCTION 1.01 The presence of sediment in rivers has its origin in soil erosion. 1.02 Erosion encompasses a series of processes that have the effect of loosening and moving away soil and rock materials under the action of water and wind. 1.03 The effect of erosion is the denudation of the land surface. 1.04 The rate of landscape denudation can be quantified from a geologic perspective. 1.05 For instance, the number of millimeters per 100 years can be used as a measure of the erosive activity of a region. 1.06 Geologic measures of landscape denudation appear insignificant when compared to the typical timespan of human activity. 1.07 However, the quantities of sediment moved may be important when considering the impact that sediment loads have on the operation of reservoirs and other hydraulic structures. 1.08 A distinction is made made between the quantity of sediment removed at the source and the quantity of sediment delivered to a downstream point. 1.09 Gross sediment production refers to the amount of sediment eroded and removed from the source. 1.10 Sediment yield refers to the actual delivery of eroded soil particles to a given downstream point. 1.11 Since the eroded particles may be deposited before they reach the downstream point of interest, sediment yield quantities are generally less than gross sediment production quantities. 1.12 The ratio of sediment yield to gross sediment production in comparable units is the sediment delivery ratio. 1.13 Gross sediment production is measured in metric tons per hectare per year. 1.14 Sediment yield is measured in metric tons per day at the catchment outlet or some other point of interest. 1.15 Erosion rates can be either normal or accelerated. 1.16 Normal erosion has been occurring at variable rates since the first solid materials formed on the surface of the Earth. 1.17 Normal erosion is extremely slow in most places, and is largely a function of climate, parent rocks, precipitation, topographic relief, and vegetative cover. 1.18 Accelerated erosion occurs at a much faster rate than normal, usually through human-induced reduction of vegetative cover. 1.19 Deforestation, overgrazing, overcultivation, urban sprawl, and the systematic destruction of natural vegetation result in accelerated erosion. 1.20 There are four types of erosion: 1. Sheet erosion 2. Rill erosion 3. Gully erosion 4. Channel erosion. 1.21 Sheet erosion is the wearing away of a thin layer on the land surface, primarily by overland flow. 1.22 Rill erosion is the removal of soil by small concentrations of flowing water. 1.23 Gully erosion is the removal of soil from channels that are large enough so they cannot be removed by normal cultivation. 1.24 Channel erosion is the erosion occurring in stream channels in the form of streambank erosion or streambed degradation. 1.25 Upland erosion refers to sheet and rill erosion. 1.26 Channel erosion refers to all other sediment sources.
2. UNIVERSAL SOIL LOSS EQUATION 2.01 Upland erosion is calculated with the Universal Soil Loss Equation. 2.02 The Universal Soil Loss Equation calculates soil loss as a product of six factors:
Eq. 1
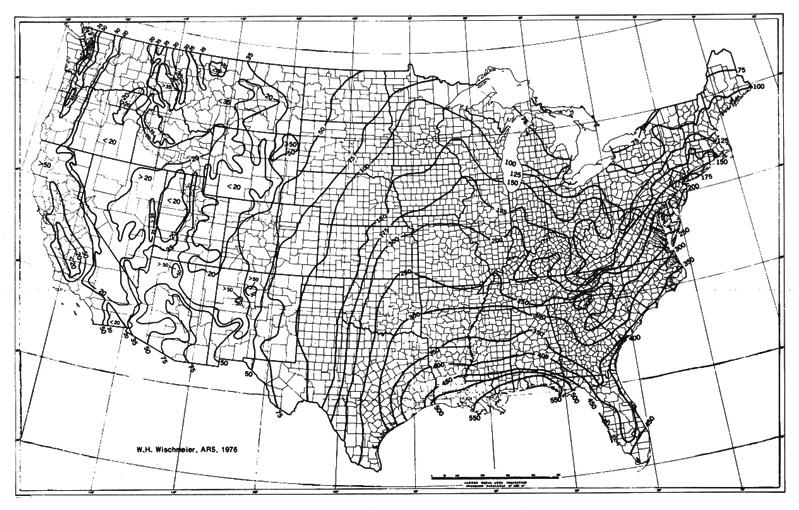
2.03 in which A = annual soil soil due to sheet and rill erosion, in tons per acre, R = rainfall factor K = soil erodibility factor L = slope length factor S = slope gradient factor C = crop management n factor P = erosion control practice factor. 2.04 Values of R applicable to the contiguous United States are shown in this figure. Fig. 07
2.05 In the United States, values of R vary from less than 20 in the Great Basin of Nevada and Utah, to 550 along the Gulf Coast in Louisiana. 2.06 The soil erodibility factor K is a measure of the resistance of a soil surface to erosion. 2.07 It is defined as the amount of soil loss, in tons per acre per year, per unit of rainfall factor R, for a unit plot. 2.08 A unit plot is 72.6 ft long, with a uniform lengthwise gradient of 9%, in continuous fallow, tilled up and down the slope. 2.09 Values of K for selected U.S. soils are shown in this table.
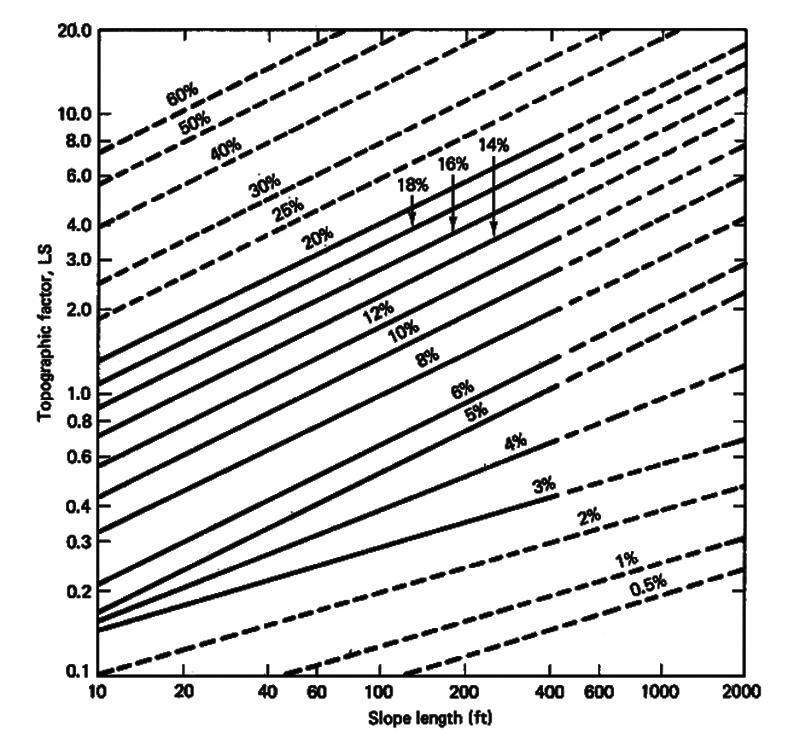
2.10 The rate of soil erosion by flowing water is a function of slope length and gradient. 2.11 For practical purposes, these two characteristics are combined into a single topographic factor LS. 2.12 The topographic factor is defined as the ratio of soil loss from a slope of given length and gradient to the soil loss from a unit plot of 72.6 ft length and 9% gradient. 2.13 Values of the topographic factor LS are shown in this figure. Fig. 08
2.14 The crop management factor C is defined as the rate of soil loss from a certain combination of vegetative cover and management practice to the soil loss resulting from tilled, continuous fallow. 2.15 Values of C vary from as little as 0.0001 for undisturbed forest land to a maximum of 1 for disturbed areas with no vegetation. 2.16 Values of C for cropland are estimated on a local basis. 2.17 Values of C for rangelands and disturbed forests are shown in this table.
2.18 Values of C for undisturbed forests are shown in this table.
2.19 The erosion control practice factor is defined as the ratio of soil loss under a certain erosion-control practice to the soil loss resulting from straight row farming. 2.20 Values of P have been established for contouring and contour strip cropping. 2.21 In contour strip cropping, strips of sod or meadow are alternated with strips of row crops or small grains. 2.22 Values of P for contour-farmed terraced fields are shown in this table.
2.23 The Universal Soil Loss Equation computes upland erosion from small watersheds on an annual basis. 2.24 It includes the detachment and transport components, but is does not account for the deposition component. 2.25 Therefore, the equation cannot be used to compute sediment yield. 2.26 For example, for a 1000-km2 basin, only 5% of the soil loss computed by the Universal Soil Loss Equation may appear as sediment yield at the basin outlet. 2.27 The remaining 95% is redistributed on uplands or flood plains, and it does not constitute a net loss of sediment from the drainage basin.
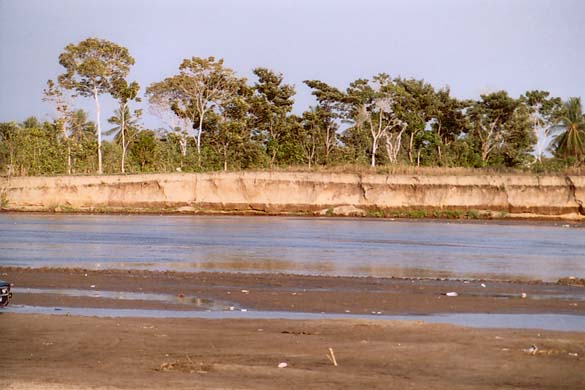
3. CHANNEL EROSION 3.01 Channel erosion includes gully erosion, streambank erosion, streambed degradation, floodplain scour, and other sources of sediment, excluding upland erosion. 3.02 Gullies are incipient or new channels in process of development. 3.03 Gully growth is usually accelerated by climatic events, improper land use, or changes in stream base levels. 3.04 Significant gully activity is found in regions of moderate to steep topography with thick soil mantles. 3.05 Gullies are local phenomena; in general, the total sediment outflow from gullies is usually less than that of sheet and rill erosion. 3.06 Streambank erosion and streambed degradation can be significant in certain cases. 3.07 Streambank erosion may be caused by changes in channel alignment and/or removal of natural vegetation from streambanks. Fig. 12
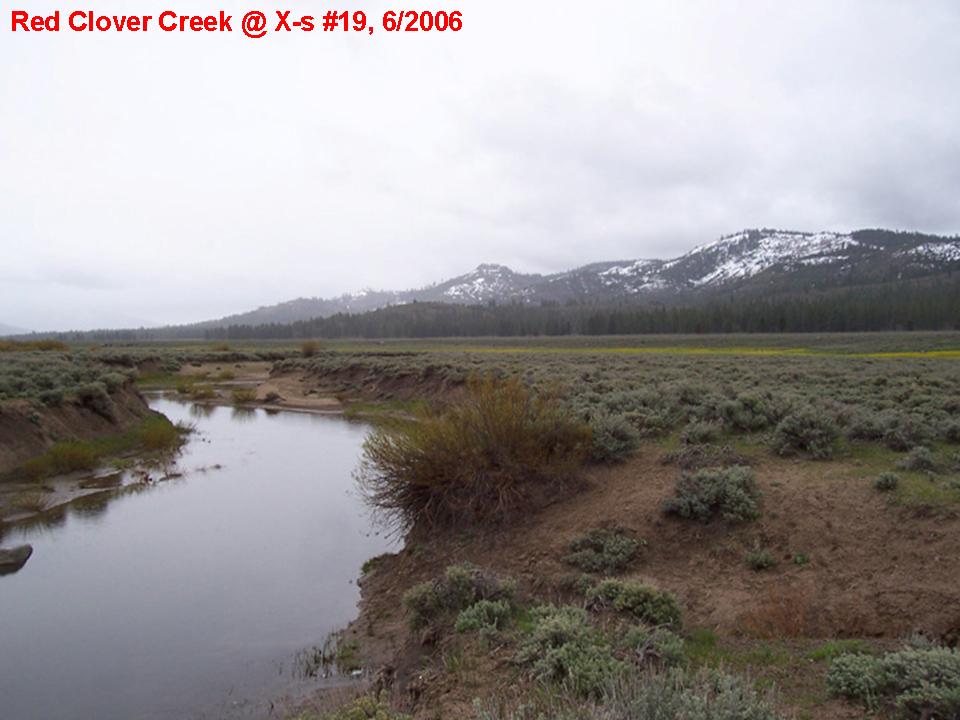
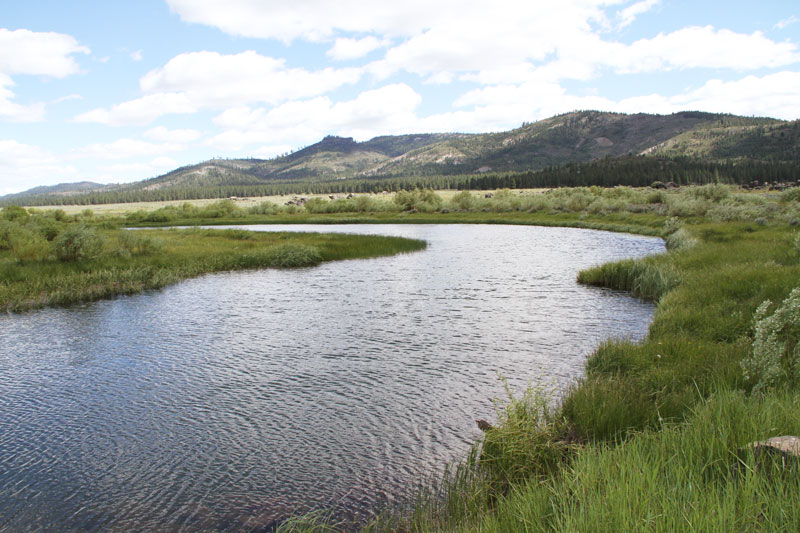
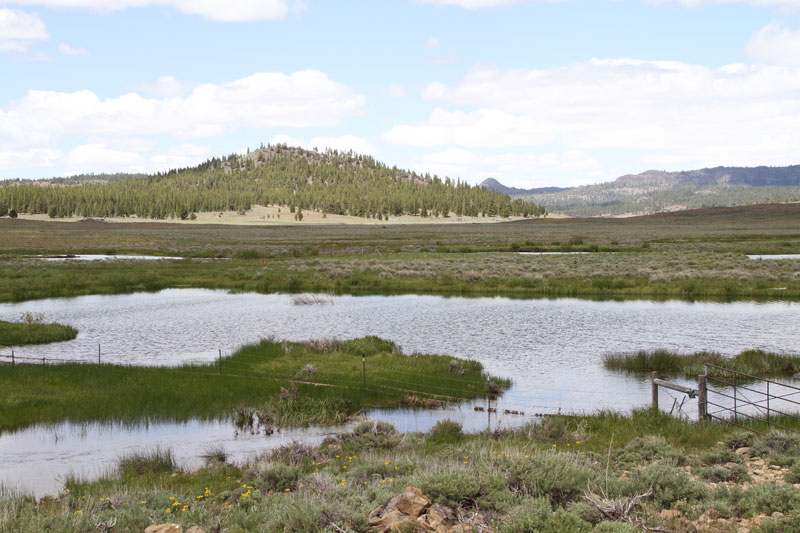
3.08 A case study of streambank erosion and successful restoration is that of Red Clover Creek, in Plumas County, California. 3.09 In the 1950s, a program of beaver dam removal and willow removal using aerial herbicide spraying was implemented in Red Clover Creek. 3.10 These actions, together with the long standing effects of heavy grazing, brought Red Clover Creek to the brink of disaster. 3.11 The 1955 flood was the catalyst for the massive gully which cut through the valley, and continued through the 1980s. 3.12 Since 2006, pond-and-plug techniques for stream restoration have led to the elimination of the gully and to the recovery of the original channel. 3.13 The restoration raised the water level in the channel up to 14 ft, replenishing baseflow and enhancing wetland function. Fig. 01
Fig. 02
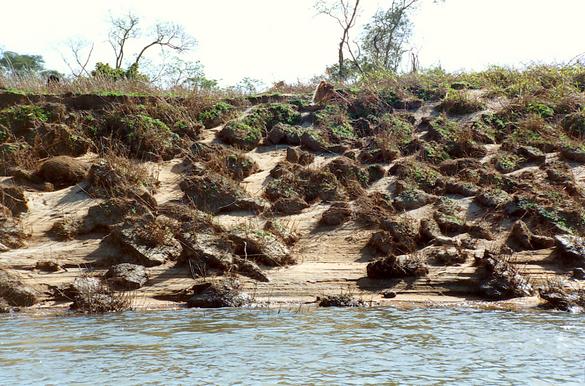
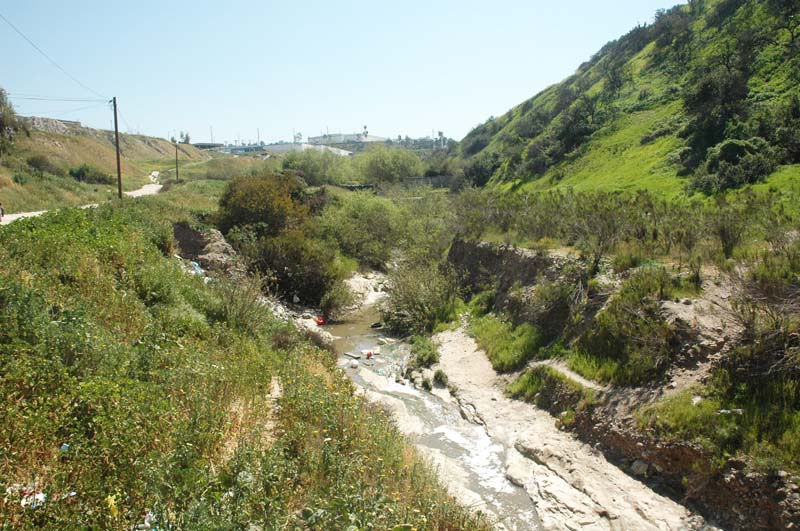
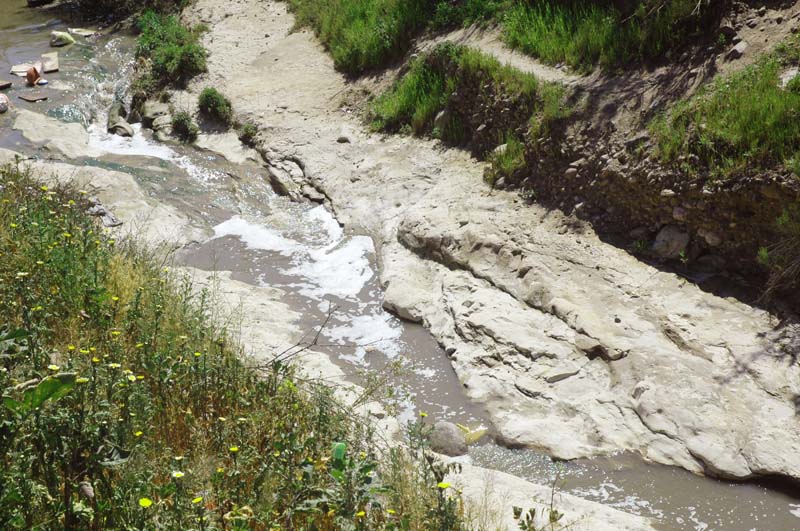
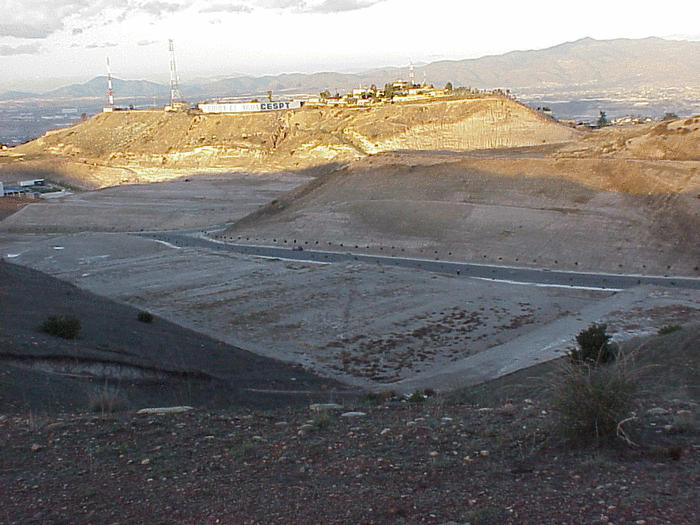
3.14 A case study of streambed degradation is represented by the phenomenon referred to as "hungry water." 3.15 Hungry water flowing downstream of a newly constructed dam will cause streambed degradation. 3.16 For example, in the Aguaje de la Tuna creek, in Tijuana, Mexico, two sediment retention dams were built in 1992 for the purpose of controlling sediment. 3.17 A year later, in 1993, a heavy downpour tested the effectiveness of the dams. 3.18 While the dams did retain the sediment, the hungry water released rushed downstream, eroding the valley floor down to the underlying bedrock within a short time. 3.19 The total depth of degradation was more than 3 m. Fig. 03
Fig. 04
3.20 In practice, streambank erosion and streambed degradation at a site are assessed by comparing cross sectional data at two suitable times to determine width and/or depth changes and, consequently, amounts of soil removal. Fig. 13
3.21 Human activities such as strip mining and construction have the potential to greatly accelerate erosion rates. 3.22 Anthropogenic land disturbances have a substantial impact on sediment production. Fig. 14
3.23 Best Management Practices or BMP's are used to control erosion from disturbed sites. 3.24 With a judicious choice of factors, the USLE may be used to compute erosion from disturbed sites.
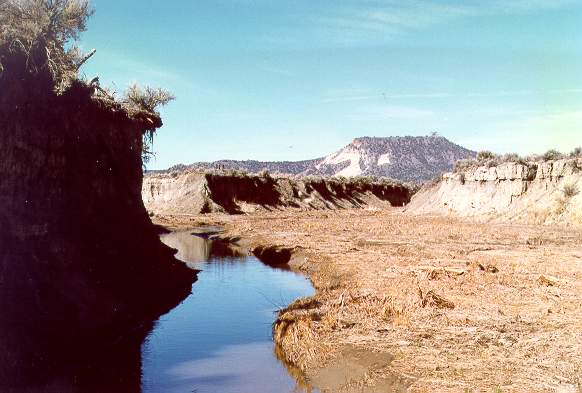
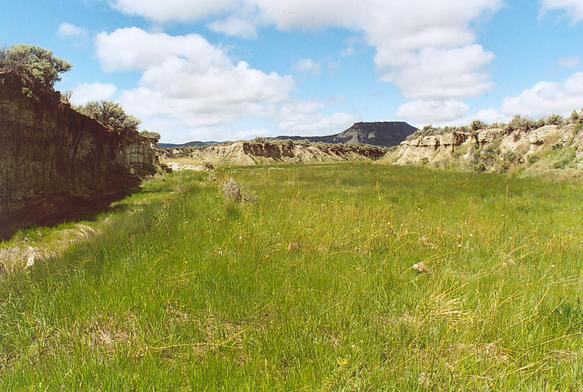
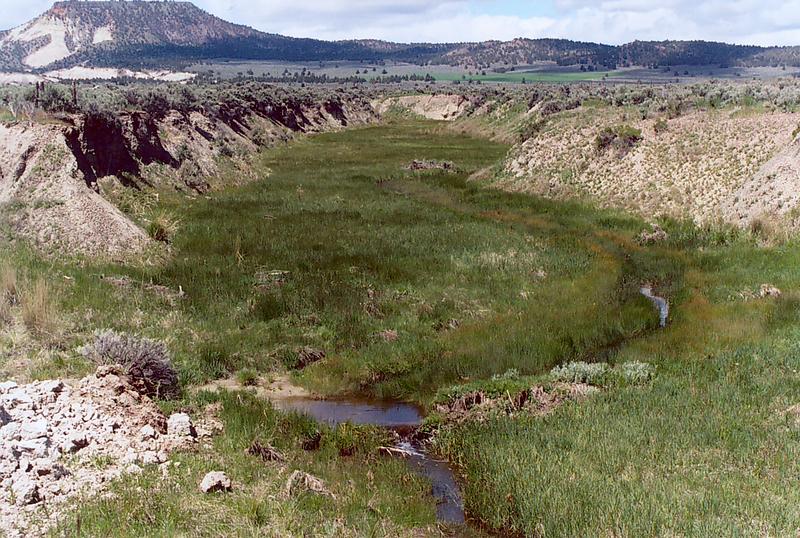
4. CAMP CREEK, OREGON 4.01 The experience of Camp Creek, in Central Oregon, provides an excellent example of accelerated gully development and subsequent control. 4.02 Prior to the 1900s, the area drained by Camp Creek was a grassy wetland, featuring grassy vegetation and a shallow water table. 4.03 Around the turn of the twentieth century, overgrazing of the meadow led to increased surface runoff and incipient gully development. 4.04 Severe floods triggered the formation of a deeply incised channel which cut through the valley, with depths up to 7.5 m and widths up to 30 m. 4.05 Beginning in 1968, up to 6 km of Camp Creek were fenced by the Bureau of Land Management to exclude livestock, thus eliminating grazing in the creek. 4.06 Over the years since the original fencing, the exclusion of livestock has led to the built-up of the streambed, with net aggradation continuing to date. 4.07 In the 15-yr period from 1989 to 2004, net aggradation in Camp Creek has been estimated to be 0.6-0.9 m. Fig. 05
Fig. 06
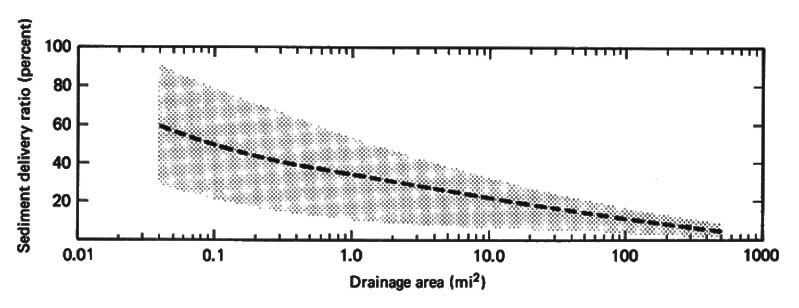
5. SEDIMENT YIELD 5.01 In engineering applications, the quantity of sediment eroded at the sources is not as important as the quantity of sediment delivered to a downstream point, i.e., the sediment yield. 5.02 Sediment yield is calculated by multiplying the gross sediment production by a sediment delivery ratio that varies in the range 0-1. 5.03 The sediment delivery ratio is a function of: 1. Sediment source, 2. Proximity of sediment source to the fluvial transport system, 3. Density and condition of the fluvial transport system, 4. Sediment size and texture, and 5. Catchment characteristics. 5.04 Not all sediments originating in sheet and rill erosion are likely to enter the transport system. 5.05 Sediments produced by channel erosion are generally closer to the transport system and, therefore, more likely to be delivered to downstream points. 5.06 The amount of sediments delivered to downstream points will depend on the ability of the fluvial transport system to entrain and hold on to the sediment particles. 5.07 Silt and clay particles can be transported much more readily than sand particles. 5.08 High catchment relief often indicates both high erosion and high sediment delivery ratio. 5.09 High channel density is usually an indication of an efficient transport system and, therefore, of a high sediment delivery ratio. 5.10 The sediment delivery ratio is the ratio of sediment yield to gross sediment production. 5.11 Estimates of sediment yield can be obtained by reservoir sedimentation surveys. 5.12 Alternatively, sediment yield can be evaluated by a direct measurement of sediment load at the point of interest. 5.13 Estimates of gross sediment production can be obtained with the Universal Soil Loss Equation. 5.14 When warranted, this estimate can be augmented by field measurements of gully and channel erosion. 5.15 Statistical analysis can be used to develop regional regression equations to predict the sediment delivery ratio. 5.16 The simplest prediction equation is based solely on drainage area, as shown here. 4.17 This figure shows that sediment delivery ratio varies approximately in inverse proportion to the 1/5 power of the drainage area. Fig. 09
5.18 The larger the drainage area, the smaller the catchment relief, and the greater the chances for sediment deposition within the catchment. 5.19 Statistical analysis has also been used to develop regional equations for the prediction of sediment yield. 5.20 The Dendy and Bolton formula is a good example of a statistically based sediment yield equation. 5.21 Dendy and Bolton studied sedimentation data from about 1500 reservoirs, ponds, and detention basins. 5.22 The data showed that annual sediment yield per unit area increased sharply as mean annual runoff Q increased from 0 to 2 in. 5.23 Thereafter, for mean annual runoff from 2 to 50 in, annual sediment yield per unit area decreased exponentially. 5.24 The combined Dendy and Bolton sediment yield equations are the following: 5.25 For mean annual runoff Q less than or equal to 2 inches:
Eq. 2
5.26 For mean annual runoff Q greater to 2 inches:
Eq. 3
5.27 In these equations, mean annual runoff Q is in inches, drainage area A is in square miles, and sediment yield S is in tons per square mile per year. 5.28 These equations should be used with caution. 5.29 In certain cases, local factors such as soils, geology, topography, land use, and vegetation may have a greater influence on sediment yield than either mean annual runoff or drainage area. Fig. 01
Fig. 02
Fig. 03
Fig. 04
Fig. 05
Fig. 06
Fig. 07
Fig. 08
Fig. 09
Fig. 10
Fig. 11
Fig. 12
Fig. 13
Fig. 14
Narrator: Victor M. Ponce Music: Fernando Oñate Editor: Flor Pérez
Copyright © 2011 Visualab Productions All rights reserved
| ||||||||||||||||||||||||||||||||||||||||||||||||||||||||||||||||||||||||||||||||||||||||||||||||||||||||||||||||||||||||||||||
