|
OPEN-CHANNEL HYDRAULICS: LECTURE 115 - SEDIMENT DEPOSITION
IN RESERVOIRS
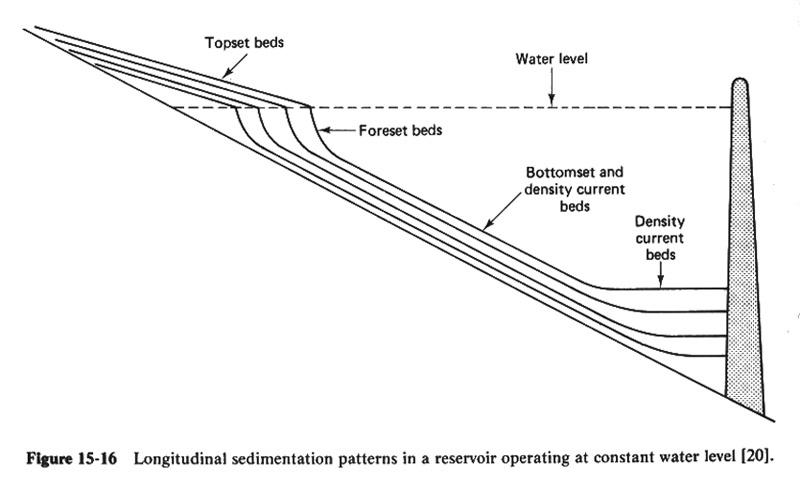
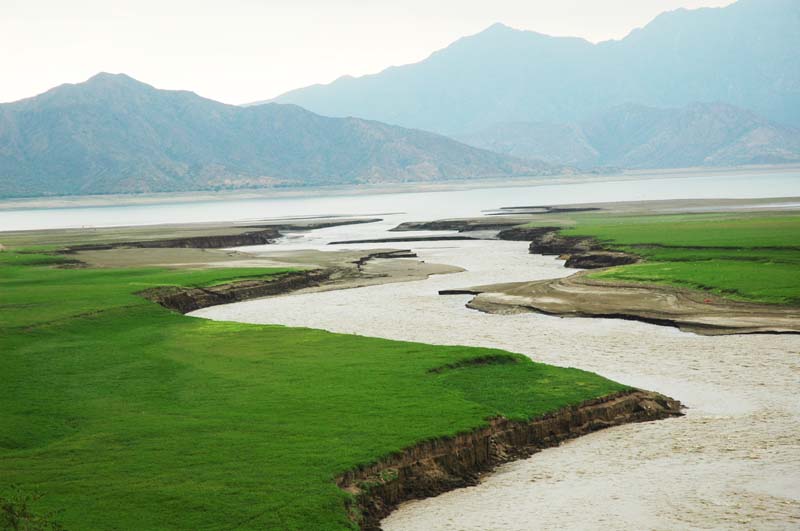
1. SEDIMENT DEPOSITION 1.01 The concepts of sediment transport and sediment yield are essential to the study of sediment deposition in reservoirs. 1.02 Sediment is produced at upland and channel sources and transported downstream by the action of flowing water. 1.03 When the flowing water is temporarily detained, as in the case of an instream reservoir, its ability to continue to entrain sediment is substantially impaired, and deposition takes place. 1.04 Reservoirs always deposit sediment. 1.05 Deposition occurs within and immediately upstream of the reservoir, as shown here. Fig. 05
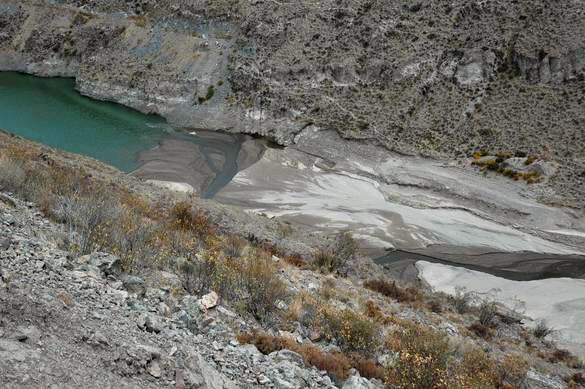
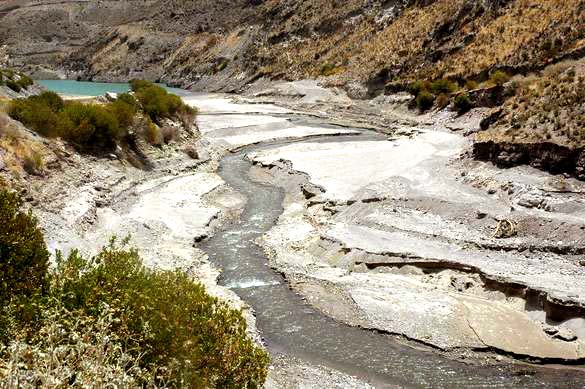
1.06 First, deposition of the coarser size fractions takes place near the entrance to the reservoir. Fig. 04
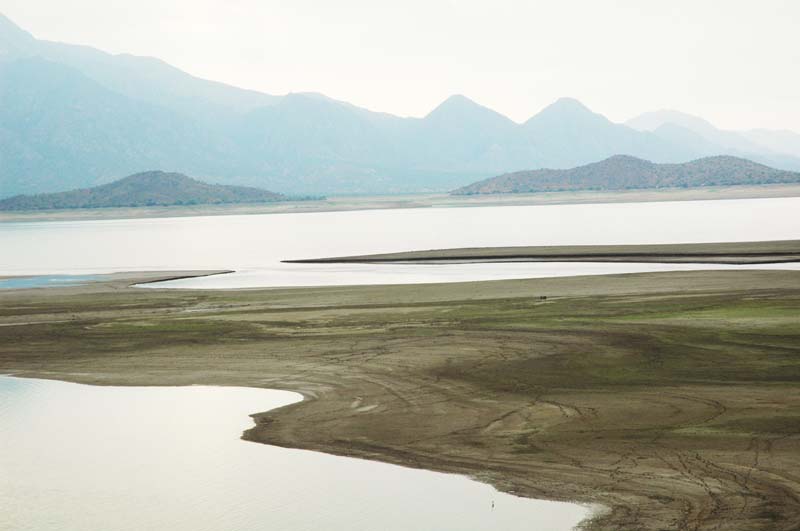
1.07 As water continues to flow into the reservoir and over the dam, the depositional delta continues to grow in the direction of the dam until it eventually fills the entire reservoir. Fig. 02
1.08 The finer fractions are deposited near the dam. 1.09 The process is usually slow but relentless. 1.10 Typically, reservoirs may take 50 to 100 years to fill up, and in some instances, up to 500 years or more. 1.11 The rate of sediment deposition in reservoirs is a matter of considerable economic and practical interest. 1.12 Reservoirs are key features of water resource development projects. 1.13 Therefore, the question of the design life of a reservoir is appropriate, given that most reservoirs will eventually fill with sediment. 1.14 In an extreme case, the filling can occur in a single storm, as in the case of a small sediment retention basin located in a semiarid or arid region. 1.15 Conversely, a large reservoir located in a subhumid or humid region may take hundreds of years or more to fill up.
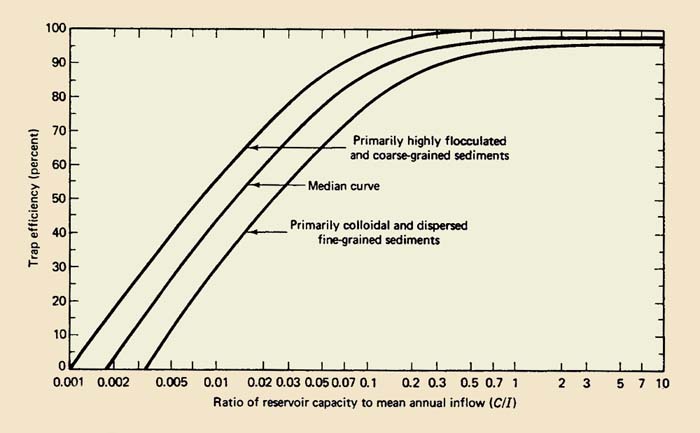
2. TRAP EFFICIENCY 2.01 The sediment deposited in a reservoir is the difference between incoming and outgoing sediment. 2.02 The incoming sediment is quantified by the sediment yield. 2.03 The outgoing sediment is quantified by the trap efficiency, defined as the ratio of trapped sediment to incoming sediment. 2.04 Trap efficiency is a function of: 1. The ratio of reservoir volume to mean annual runoff volume, and 2. The sediment characteristics. 2.05 The trap efficiency is quantified by the Brune curves, shown here. Fig. 06
2.06 These curves show the trap efficiency, in percentage, as a function of the reservoir capacity-to-mean annual inflow ratio C/I, for three typical sediment characteristics. 2.07 The Brune graph shows that the smaller reservoirs have low trap efficiency. 2.08 Conversely, the larger reservoirs are very efficient in trapping sediment.
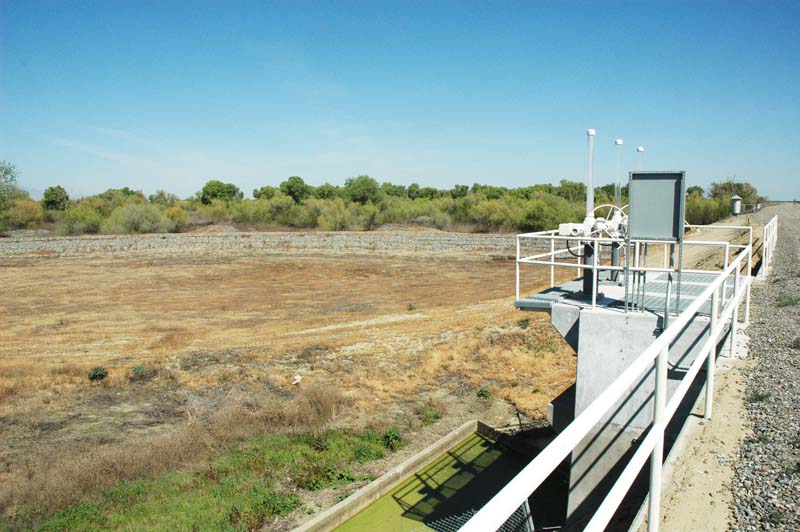
3. DESIGN LIFE 3.01 The design life of a reservoir is the period required for the reservoir to fulfill its intended purpose. 3.02 For instance, structures designed by the USDA Natural Resources Conservation Service for watershed protection and flood prevention programs may have a design life of 50 to 100 years. 3.03 Due to reservoir sedimentation, provisions are usually made to guarantee the full design reservoir water-storage capacity for the design life. 3.04 This may require: 1. Cleaning out the reservoir sediment deposits at predetermined intervals during the life of the structure, or 2. Providing a reservoir storage capacity large enough to store the accumulated sediment deposits without encroachment on the design water storage volume. 3.05 Calculations of filling rates and sediment accumulation are part of the design and operation of reservoir projects. Fig. 01
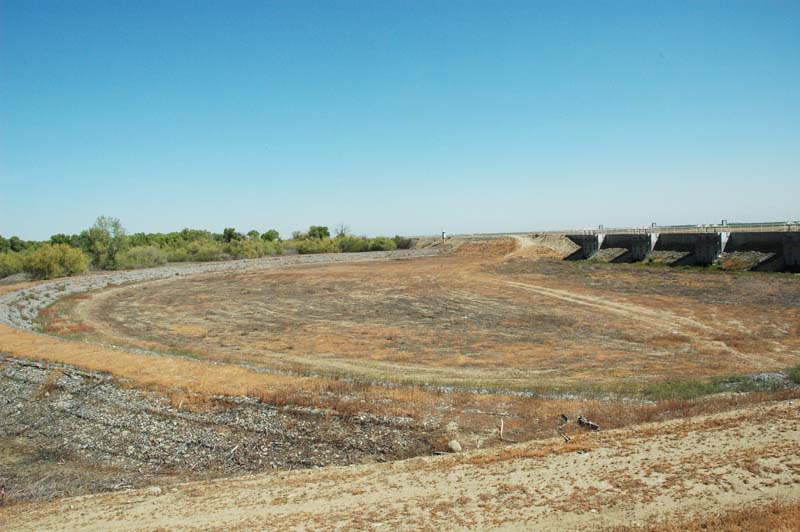
3.06 The spatial distribution of sediment deposits varies with the nature of the sediment, the shape of the reservoir, the topography of the reservoir floor, the nature of the approach channel, the detention time, and the purpose and operation of the reservoir. Fig. 03
4. EXAMPLE 4.01 Calculate the number of years to fill a planned reservoir, given the following data:
Eq. 1
4.02 The mean annual inflow to the reservoir, in cubic meters, is:
Eq. 2
4.03 The initial capacity-to-inflow ratio is:
Eq. 3
4.04 The annual sediment inflow in kilograms is:
Eq. 4
4.05 The annual sediment inflow in cubic meters is:
Eq. 5
4.06 The annual sediment volume retained by the reservoir, in cubic meters, is:
Eq. 6
4.07 in which Et is the trap efficiency, in percentage, obtained from the Brune curves. 4.08 For this example, we choose an interval of storage equal to 1/5 of the reservoir capacity, that is, 2,000,000 m3.
Eq. 7
4.09 The number of years Δt to fill each interval of storage is:
Eq. 8
4.10 The computations are shown in this table. Column 1 shows the interval. Column 2 shows the reservoir capacity, decreasing from 10,000,000 to 0 in five intervals Column 3 shows the accumulated volume of sediments Column 4 shows the capacity-to-inflow ratio at the end of each interval Column 5 shows the average capacity-to-inflow ratio between the intervals Column 6 shows the trap efficiency obtained from the Brune curves, for the average ratios of Column 5, and the specified type of sediment. Column 7 shows the number of years that it takes to fill each interval of storage. 4.11 The number of years to fill the reservoir is the sum of Column 7, that is, 93 years.
5. DEBRIS BASINS 5.01 Sediment retention, or debris basins, are small reservoirs located in upland areas for the purpose of trapping sediment and debris before they are able to reach the main fluvial network. 5.02 Debris is a general term used to describe the assortment of cobbles, boulders, branches, and other vegetative material that may clog channels and hydraulic sructures. 5.03 This may cause them to reach a critical design condition, often resulting in structural failure. 5.04 Debris basins are placed in upland areas with the specific purpose to temporarily detain debris. 5.05 They are usually relatively small, and designed to be cleaned out at appropriate intervals. 5.06 Some basins may be designed to fill up during one storm event. 5.07 Others may have a longer design life. 5.08 Project costs and site conditions determine the size of debris basins. 5.09 Sediment yield determinations for debris basin design usually consider both short-term and long-term processes. 5.10 The long-term analysis is based on a suitable sediment rating curve. 5.11 However, for infrequent storms, sediment concentrations may exceed long-term averages by a factor of 2 or 3. Fig. 01
Fig. 02
Fig. 03
Fig. 04
Fig. 05
Fig. 06
Fig. 07
Fig. 08
Narrator: Victor M. Ponce Music: Fernando Oñate Editor: Flor Pérez
Copyright © 2011 Visualab Productions All rights reserved
| |||||||||||||||||||||||||||||||||||||||||||||||||||||||||||||||||||||||||||||||
