QUESTIONS
What is routing? What types of waves are used in describing unsteady open channel flow processes?
|
Routing is a procedure to calculate the variation of flows in time and
space.
Three types of waves are used in describing unsteady open channel
flow processes: (1) kinematic waves, (2) diffusion waves, and (3)
dynamic waves.
|
What is model calibration? What is model verification?
|
Model calibration is the process by which the parameters describing the
behavior of the system are identified based on known values of input and
output.
Model verification relates to the process of testing the model
with actual data to establish its predictive accuracy. To calibrate and
verify a model, it is usually necessary to assemble two data sets. The
first data set is used in model calibration, while the second data set is
used in model verification.
|
In the Muskingum method, what does the parameter K represent? What does the parameter X represent?
|
In the Muskingum method, the parameter K is interpreted as the travel
time of the flood wave from the upstream end to the downstream end of the
channel reach. Therefore, the parameter K accounts for the translation
portion of the routing.
The parameter X accounts for the storage portion
of the routing, i.e., the property of the flow and channel to attenuate
(i.e., diffuse) the flow hydrograph.
|
How does channel routing differ from reservoir routing? What differences are to be noted in the routed hydrographs?
|
In channel routing, storage is a function of inflow and outflow; in
reservoir routing, storage is a function of outflow only.
Translation is the primary mechanism in channel routing; storage is the primary
mechanism in reservoir routing.
In channel routing there is a finite lag between the timing of inflow and outflow; in reservoir routing there is
no apparent lag between the timing of inflow and outflow.
In reservoir routing, peak outflow and maximum storage occur at the time that inflow
equals outflow, while this is not the case for channel routing.
|
What is the kinematic wave celerity? What is the practical range of turbulent flow values of β, the rating constant used in the kinematic wave celerity?
|
The kinematic wave celerity is the velocity of a kinematic wave.
The practical range of turbulent flow values of β is between 1 and 5/3.
|
What is the order of accuracy of a numerical scheme? What is the difference between numerical diffusion and numerical dispersion in connection with kinematic wave solutions?
|
The order of accuracy of a numerical scheme measures the ability of the
scheme to reproduce (i.e., recreate) the terms of the differential
equation. In general, the higher the order of accuracy of a scheme, the
better it is able to reproduce the terms of the differential equation.
Numerical diffusion and dispersion are created as a byproduct of
numerical solutions of the kinematic wave equation. In general, first
order schemes create both numerical diffusion and dispersion; second
order schemes create only numerical dispersion. Certain first order
schemes can create only numerical diffusion.
|
What is a linear model in the context of kinematic wave routing? What is a nonlinear model?
|
In kinematic wave routing, a linear model is a model in which the
coefficients and parameters have been assumed to be constant in time, and
not to vary with the flow.
A nonlinear model is one in which the coefficients and parameters are assumed to be variable in time, i.e., to
vary with the flow.
|
Why are the results of convex routing dependent on the grid size?
|
The results of convex routing are dependent on the grid size because the
method is essentially a first-order numerical scheme, featuring a
substantial amount of numerical diffusion and dispersion for values of
(Courant number) C other than 1. This renders the method grid-dependent.
|
What is a diffusion wave? How does it differ from a kinematic wave?
|
A diffusion wave is a wave formulated by using a statement of steady
nonuniform flow in lieu of the complete momentum equation. This gives
the diffusion wave the capability to describe the diffusion naturally
present in typical unsteady open channel flow problems.
The diffusion wave differs from the kinematic wave because the kinematic wave cannot describe diffusion. Therefore, the diffusion wave is
an improvement over the kinematic wave.
|
What is hydraulic diffusivity? Why is it important in flood routing?
|
The hydraulic diffusivity is the coefficient of the second order term of
the diffusion wave equation.
The hydraulic diffusivity is important in
flood routing because it is the physical parameter that describes the
amount of flood wave attenuation. The greater the hydraulic diffusivity,
the greater the flood wave attenuation.
|
What values of parameters X and C optimize numerical diffusion and minimize numerical dispersion in the Muskingum-Cunge method?
|
In the Muskingum-Cunge method, numerical diffusion is optimized by
matching the physical and numerical diffusivities (Eq. 9-68), in the
range X less than 0.5. Numerical dispersion is minimized by keeping the
Courant number as close to 1 as practicable.
|
Why are negative values of X entirely possible in Muskingum-Cunge routing? Why are values of X in excess of 0.5 unfeasible?
|
Negative values of X are entirely possible in Muskingum-Gunge routing
because for relatively small values of reach length Δx, it is necessary
for X to be negative to preserve the moment-matching characteristic of
the method (Eq. 9-68).
A value of X greater than 0.5 is unfeasible
because it implies that the hydraulic diffusivity is negative (Eq. 9-68),
which is a physical impossibility.
|
What is the Courant number? What is the cell Reynolds number?
|
The Courant number can be defined in many ways: (1) the ratio of wave
celerity c to grid celerity Δx / Δt ; (2) the ratio of time interval Δt to
travel time K = Δx/c ; (3) the ratio of spatial resolution L/Δx to
temporal resolution T/Δt. These definitions are one and the same.
The cell Reynolds number is the ratio of hydraulic diffusivity to grid
diffusivity.
|
Describe the difference between linear and nonlinear solutions to channel routing problems.
|
Linear (i.e., constant parameter) solutions do not cause wave steepening;
nonlinear (i.e., variable parameter) do cause wave steepening, and with
it, the possibility of shock formation. Within limits, nonlinear
solutions are apt to be more accurate representations of reality than
their linear counterparts.
|
What is a dynamic wave? How does it differ from the diffusion and kinematic waves?
|
A dynamic wave is formulated by taking into account the complete equation
of motion, or conservation of momentum, without the simplifications of
kinematic and diffusion waves. As such, it is the most complete unsteady
open channel flow wave.
Dynamic wave solutions are far more
complicated than either kinematic or diffusion wave solutions.
|
How does the method of finite differences differ from the method of characteristics? What is a double sweep algorithm?
|
The method of finite differences is based on the discretization of the
partial differential equations following a chosen numerical scheme. The
method of characteristics is based on the conversion of the set of
partial differential equations into a related set of ordinary
differential equations, and the solution of the latter along a
characteristic grid, i.e., a grid that follows characteristic directions.
A double sweep algorithm allows the inversion of the coefficient matrix
by storing only the nonzero entries, which are located along a narrow
band surrounding the main diagonal.
|
Discuss the influence of the loop in the rating in determining whether an open channel flow wave is dynamic in nature.
|
The loop in the rating curve determines whether the unsteady flow is
dynamic in nature. The width of the loop is a measure of the
unsteadiness of the phenomena, wider loops corresponding to highly
unsteady flows, i.e. dynamic wave flow. If the loop is narrow, it
implies that the flow is mildly unsteady, perhaps a diffusion wave. If
the loop is nonexistent, the flow is indeed kinematic flow. In fact, the
basic assumption of kinematic flow is that momentum can be simulated as
steady uniform flow; that is, that the rating curve is unique.
|
What is the Vederkinov number? How does it differ from the Froude number?
|
The Vedernikov number V is defined by Eq. 9-80. It is the product of the exponent of the rating β (in Eq. 9-13) times the Froude number. For V = 1, the (dynamic) hydraulic diffusivity (in Eq. 9-81) vanishes.
|
What is the effect of the inclusion of a dynamic component in diffusion wave modeling?
|
In diffusion wave modeling, the inclusion of a dynamic component results
in the hydraulic diffusivity being also a function of the rating curve
parameter β and the Froude number (Eq. 9-78). This feature gives the
diffusion wave model an enhanced capability for simulating dynamic waves.
The diffusion wave solution with dynamic component is applicable to high
Froude number flows, particularly those near or above critical.
|
PROBLEMS
Given the following inflow hydrograph to a certain stream channel reach, calculate the outflow by the Muskingum method.
Check your results with ONLINE ROUTING 04.
| Time (h) |
0 |
1 |
2 |
3 |
4 |
5 |
6 |
7 |
8 |
9 |
10 |
11 |
12 |
| Flow (m3/s) |
10 |
20 |
40 |
80 |
120 |
150 |
120 |
60 |
50 |
40 |
30 |
20 |
10 |
|
Assume K = 1 h, X = 0.2, and Δt = 1 h.
|
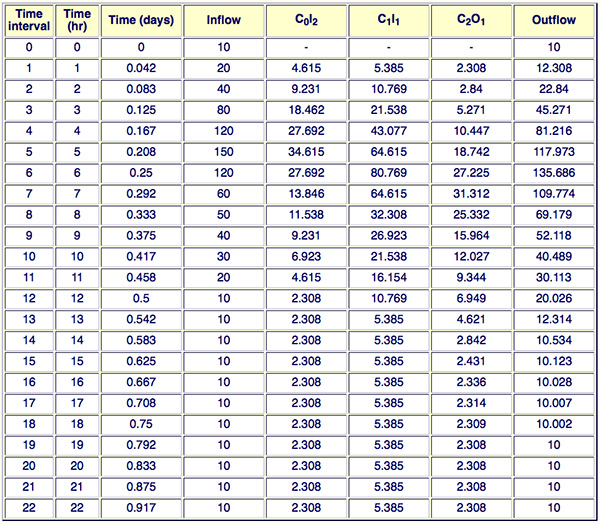
Using Eqs. 9-4 to 9-6, the Muskingum routing coefficients are the following: C0 = 0.231, C1 = 0.538, and C2 = 0.231.
The results of the routing computation, using Eq. 8-15, are shown in the following table.
Time
(h) |
Inflow
(m3/s) |
Outflow
(m3/s) |
| 0 |
10 |
10.000 |
| 1 |
20 |
12.308 |
| 2 |
40 |
22.840 |
| 3 |
80 |
45.271 |
| 4 |
120 |
81.216 |
| 5 |
150 |
117.973 |
| 6 |
120 |
135.686 |
| 7 |
60 |
109.774 |
| 8 |
50 |
69.179 |
| 9 |
40 |
52.118 |
| 10 |
30 |
40.489 |
| 11 |
20 |
30.113 |
| 12 |
10 |
20.026 |
| 13 |
10 |
12.314 |
| 14 |
10 |
10.534 |
| 15 |
10 |
10.123 |
| 16 |
10 |
10.028 |
| 17 |
10 |
10.007 |
| 18 |
10 |
10.002 |
|
The peak outflow is 135.686 m3/s, and it occurs at 6 h. ANSWER.
The same results are obtained by running ONLINE ROUTING 04, as shown below.
|
Given the following inflow hydrograph to a certain stream channel reach, calculate the outflow by the Muskingum method.
Check your results with ONLINE ROUTING 04.
| Time (h) |
0 |
3 |
6 |
9 |
12 |
15 |
18 |
21 |
24 |
27 |
30 |
33 |
36 |
| Flow (m3/s) |
100 |
120 |
150 |
200 |
250 |
275 |
250 |
210 |
180 |
150 |
120 |
110 |
100 |
|
Assume K = 2.4 h, X = 0.1, and Δt = 3 h.
|
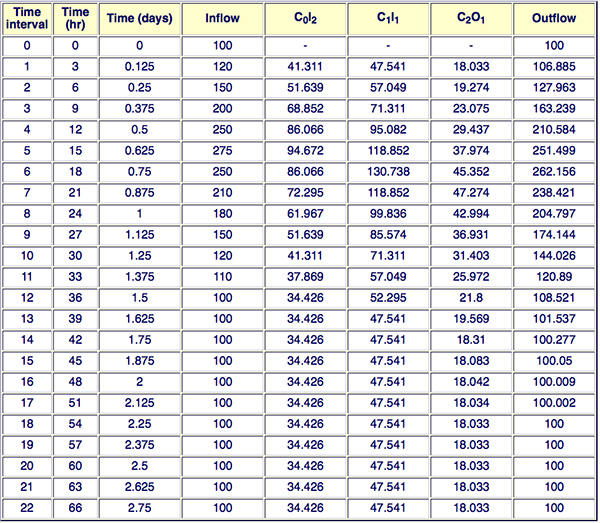
Using Eqs. 9-4 to 9-6, the Muskingum routing coefficients are the following: C0 = 0.231, C1 = 0.538, and C2 = 0.231.
The results of the routing computation, using Eq. 8-15, are shown in the following table.
Time
(h) |
Inflow
(m3/s) |
Outflow
(m3/s) |
| 0 |
100 |
100.000 |
| 3 |
120 |
106.885 |
| 6 |
150 |
127.963 |
| 9 |
200 |
163.239 |
| 12 |
250 |
210.584 |
| 15 |
275 |
251.499 |
| 18 |
250 |
262.156 |
| 21 |
210 |
238.421 |
| 24 |
180 |
204.797 |
| 27 |
150 |
174.144 |
| 30 |
120 |
144.026 |
| 33 |
110 |
120.890 |
| 36 |
100 |
108.521 |
| 39 |
100 |
101.537 |
| 42 |
100 |
100..277 |
| 45 |
100 |
100.050 |
| 48 |
100 |
100.009 |
| 51 |
100 |
100.002 |
| 54 |
100 |
100.000 |
|
The peak outflow is 262.156 m3/s, and it occurs at 18 h. ANSWER.
The same results are obtained by running ONLINE ROUTING 04, as shown below.
|
Given the following inflow and outflow hydrographs for a certain stream channel reach, calculate the Muskingum parameters K and X.
| Time (h) |
0 |
1 |
2 |
3 |
4 |
5 |
| Inflow (ft3/s ) |
2520 |
3870 |
4560 |
6795 |
8975 |
9320 |
| Outflow (ft3/s ) |
2520 |
2643 |
3598 |
4500 |
6367 |
8295 |
| Time (h) |
6 |
7 |
8 |
9 |
10 |
11 |
| Inflow (ft3/s ) |
7780 |
6520 |
5340 |
4105 |
3210 |
2520 |
| Outflow (ft3/s ) |
8900 |
7971 |
6808 |
5628 |
4439 |
3482 |
| Time (h) |
12 |
13 |
14 |
15 |
16 |
17 |
| Inflow (ft3/s ) |
2520 |
2520 |
2520 |
2520 |
2520 |
2520 |
| Outflow (ft3/s ) |
2782 |
2592 |
2540 |
2525 |
2521 |
2520 |
|
|
Storage is calculated with Eq. 9-7.
Weighted flow is: [ XI + ( 1 - X )O ]
The results of the computation are shown in the following table.
| (1) | (2) | (3) | (4) | (5) | (6) | (7) |
Time
(h) |
Inflow
(m3/s) |
Outflow
(m3/s) |
Storage
(ft3/s-h) |
Weighted flow for |
| X = 0.1 |
X = 0.2 |
X = 0.3 |
| 0 |
2520 |
2520 |
0 |
- |
- |
- |
| 1 |
3870 |
2643 |
613 |
2766 |
2888 |
3011 |
| 2 |
4560 |
3598 |
1708 |
3694 |
3790 |
3887 |
| 3 |
6795 |
4500 |
3336 |
4729 |
4959 |
5188 |
| 4 |
8975 |
6367 |
5788 |
6628 |
6889 |
7149 |
| 5 |
9320 |
8295 |
7604 |
8397 |
8500 |
8602 |
| 6 |
7780 |
8900 |
7557 |
8788 |
8676 |
8564 |
| 7 |
6520 |
7971 |
6271 |
7826 |
7681 |
7536 |
| 8 |
5340 |
6808 |
4812 |
6661 |
6514 |
6368 |
| 9 |
4105 |
5628 |
3316 |
5475 |
5323 |
5171 |
| 10 |
3210 |
4439 |
1940 |
4316 |
4193 |
4070 |
| 11 |
2520 |
3482 |
845 |
3386 |
3289 |
3193 |
| 12 |
2520 |
2782 |
233 |
2756 |
2730 |
2703 |
| 13 |
2520 |
2592 |
66 |
2585 |
2578 |
2570 |
| 14 |
2520 |
2540 |
20 |
2538 |
2536 |
2534 |
| 15 |
2520 |
2525 |
8 |
2525 |
2524 |
2523 |
| 16 |
2520 |
2521 |
5 |
2521 |
2521 |
2521 |
|
The storage (Col. 4) vs. weighted flow relations (Cols. 5 to 7) are plotted as shown in Fig. 9-4 of the text. The chosen value of X is that corresponding to the narrowest loop in the storage-weighted flow relation. In this case: X = 0.3. The value of the storage constant K is the slope of the storage-weighted flow relation for X = 0.3:
K = 1.25 h. ANSWER.
|
Develop a spreadsheet to solve the Muskingum method of stream channel routing, given the following data: (1) an inflow hydrograph of arbitrary shape, (2) baseflow, (3) storage constant K, (4) weighting factor X, and (5) time interval Δt.
Test your spread sheet with Example 9-1 in the text. Check your results with ONLINE ROUTING 04.
Given the following inflow hydrograph, use the spread sheet developed in Problem 9-4 to calculate the outflow hydrograph by the Muskingum method.
| Time (h) |
0.00 |
0.25 |
0.50 |
0.75 |
1.0 |
1.25 |
1.50 |
1.75 |
2.0 |
2.25 |
2.50 |
2.75 |
| Flow (m3/s) |
0 |
1 |
2 |
4 |
8 |
10 |
8 |
6 |
4 |
2 |
1 |
0 |
|
Assume K = 0.4 h, X = 0.15, and Δt = 0.25 h. Check your results with ONLINE ROUTING 04.
|
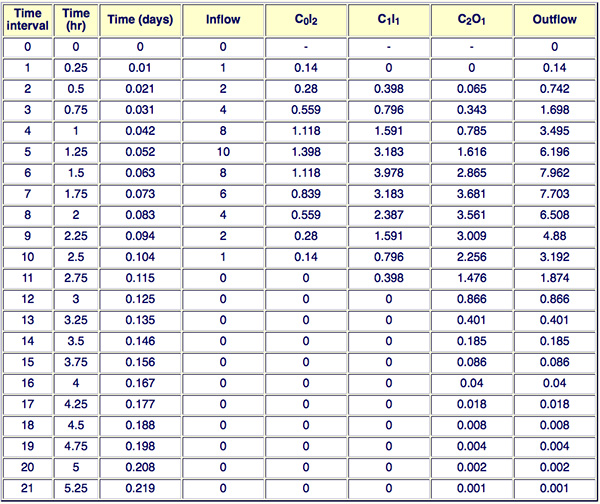
The results of the routing computation are shown in the following table.
Time
(h) |
Inflow
(m3/s) |
Outflow
(m3/s) |
| 0.00 |
0 |
0.000 |
| 0.25 |
1 |
0.140 |
| 0.50 |
2 |
0.742 |
| 0.75 |
4 |
1.698 |
| 1.00 |
8 |
3.495 |
| 1.25 |
10 |
6.196 |
| 1.50 |
8 |
7.962 |
| 1.75 |
6 |
7.703 |
| 2.00 |
4 |
6.508 |
| 2.25 |
2 |
4.880 |
| 2.50 |
1 |
3.192 |
| 2.75 |
0 |
1.874 |
| 3.00 |
0 |
0.866 |
| 3.25 |
0 |
0.401 |
| 3.50 |
0 |
0.185 |
| 3.75 |
0 |
0.086 |
| 4.00 |
0 |
0.040 |
| 4.25 |
0 |
0.018 |
| 4.50 |
0 |
0.008 |
| 4.75 |
0 |
0.004 |
| 5.00 |
0 |
0.002 |
| 5.25 |
0 |
0.001 |
|
The peak outflow is 7.962 m3/s, and it occurs at 1.5 h. ANSWER.
The same results are obtained by running ONLINE ROUTING 04, as shown below.
|
Develop a spreadsheet to estimate the parameters of the Muskingum method, given a matching set of inflow and outflow hydrographs for a certain channel reach.
A suggested algorithm is to search for the value of X that minimizes the root mean square (RMS) of the differences between predicted and measured storage.
For this purpose, several values of X (between the range 0.0 to 0.5) are tried.
For each trial value, a regression line is fitted to the (measured) storage (calculated using Eq. 9-7) versus weighted flow data, with weighted flow in the abscissas and measured storage in the ordinates.
The differences between measured storage and predicted storage, i.e., storage predicted by the regression, are calculated.
The RMS is evaluated by the following formula:
1
RMS = [ ( ______ ) Σ (S - S' )2 ] 1/2
n - 1
n
| (9-82) |
in which S = measured storage, S' = predicted storage, and n = number of values.
The X corresponding to the minimum RMS value is the estimated X.
The Muskingum parameter K is the slope of the regression line corresponding to the chosen X value.
Use Example 9-2 in the text to test your program.
Use the data of Problem 9-3 to test further the spreadsheet developed in Problem 9-6.
Route the following flood wave using a linear forward-in-time/backward-in-space numerical scheme of the kinematic wave equation (similar to the convex method).
| Time (min) |
0 |
10 |
20 |
30 |
40 |
50 |
60 |
70 |
80 |
90 |
100 |
| Flow (m3/s) |
0 |
1 |
2 |
4 |
8 |
10 |
8 |
4 |
2 |
1 |
0 |
|
Assume baseflow 0 m3/s, V = 1m/s, β = 1.5, Δx = 1200 m, and Δt = 10 min.
|
The Courant number is: C = βV (Δt / Δx) = 1.5 × 1.0 × [(10 × 60)/1200] = 0.75.
In the convex method, C0 = 0.0
Using Eqs. 9-32 and 9-33: C1 = 0.75; C2 = 0.25
The routing computations are shown below.
Time
(min) |
Inflow
(m3/s) |
C0I2
|
C1I1
|
C2O1
|
Outflow
(m3/s) |
| 0 |
0 |
- |
- |
- |
0.000 |
| 10 |
1 |
- |
0.00 |
0.000 |
0.000 |
| 20 |
2 |
- |
0.75 |
0.000 |
0.750 |
| 30 |
4 |
- |
1.50 |
0.187 |
1.687 |
| 40 |
8 |
- |
3.00 |
0.422 |
3.422 |
| 50 |
10 |
- |
6.00 |
0.856 |
6.586 |
| 60 |
8 |
- |
7.50 |
1.714 |
9.214 |
| 70 |
4 |
- |
6.00 |
2.304 |
8.304 |
| 80 |
2 |
- |
3.00 |
2.076 |
5.076 |
| 90 |
1 |
- |
1.50 |
1.269 |
2.769 |
| 100 |
0 |
- |
0.75 |
0.692 |
1.442 |
| 110 |
0 |
- |
0.00 |
0.361 |
0.361 |
| 120 |
0 |
- |
0.00 |
0.090 |
0.023 |
| 130 |
0 |
- |
0.00 |
0.006 |
0.006 |
| 140 |
0 |
- |
0.00 |
0.002 |
0.002 |
| 150 |
0 |
- |
0.00 |
0.000 |
0.000 |
|
The peak outflow is 9.214 m3/s, and it occurs at 60 min. ANSWER.
|
Derive the routing coefficients for a linear forward-in-space/ backward-in-time numerical scheme of the kinematic wave equation.
|
Q j n+1 - Q j n Q j+1n+1 - Q j n+1
___________________ + β V _________________ = 0
Δt Δx
Therefore:
Q j+1n+1 =
C0 Q j n+1 +
C1 Q j n
with C0 = (C - 1)/C ; C1 = 1/C; C = βV (Δt / Δx). ANSWER.
|
Use the routing coefficients derived in Problem 9-9 to route the inflow hydrograph of Problem 9-8.
Assume a reach length Δx = 800 m.
|
The Courant number is: C = βV (Δt / Δx) = 1.5 × 1.0 × [(10 × 60)/800] = 1.125.
Therefore, using the results of Problem 9-9:
C0 = (C - 1)/C = 0.111; and C1 = 1/C = 0.889.
For the forward-in-space/backward-in-time numerical scheme of the kinematic wave equation, the routing coefficient C2 = 0. The routing computations are shown in the following table.
Time
(min) |
Inflow
(m3/s) |
C0I2
|
C1I1
|
C2O1
|
Outflow
(m3/s) |
| 0 |
0 |
- |
- |
- |
0.000 |
| 10 |
1 |
0.111 |
0.000 |
- |
0.111 |
| 20 |
2 |
0.222 |
0.889 |
- |
1.111 |
| 30 |
4 |
0.444 |
1.778 |
- |
2.222 |
| 40 |
8 |
0.888 |
3.556 |
- |
4.444 |
| 50 |
10 |
1.111 |
7.112 |
- |
8.223 |
| 60 |
8 |
0.888 |
8.890 |
- |
9.778 |
| 70 |
4 |
0.444 |
7.112 |
- |
7.556 |
| 80 |
2 |
0.222 |
3.556 |
- |
3.778 |
| 90 |
1 |
0.111 |
1.778 |
- |
1.889 |
| 100 |
0 |
0.000 |
0.889 |
- |
0.889 |
| 110 |
0 |
0.000 |
0.000 |
- |
0.000 |
|
The peak outflow is 9.778 m3/s, and it occurs at 60 min. ANSWER.
|
Calculate the β value for a triangular channel with Chezy friction
|
By using the Chezy formula (Eq. 2-66), the discharge is:
|
Q = C A R1/2 S1/2 = K1 A3/2 / P1/2 = f (A3/2 , P -1/2) | (1) |
From Fig. 9-9:
|
P = 2d [1 + (K 2/4)]1/2 | (3) |
Eliminating d from Eqs. 2 and 3:
|
Then: P1/2 = f ( A1/4 ) | (5) |
Substituting Eq. 5 into Eq. 1:
Therefore: β = 5/4. ANSWER.
|
A large river of nearly constant width B = 900 m is seen to be rising at the rate of 10 cm/h.
At the observation point, a stage measurement indicates that the current value of discharge is 2200 m3/s.
What is a rough estimate of the discharge at a point 5 km upstream?
|
A rough estimate of the discharge at a point 5 km upstream can be obtained by discretizing the equation of continuity, Eq. 9-9, using an off-centered numerical scheme:
( Q2 - Q1 ) / Δx + ( A2 - A1 ) / Δt = 0
in which Q = discharge, A = flow area, Δt = time interval, and Δx = space interval (reach length).
Since the channel width is constant, the change in flow area per time
interval is: ΔA = B Δy, in which B = channel width, and Δy = change in stage per time interval. Then:
(Q2 - Q1) / Δx + B (Δy / Δt) = 0
Solving for the upstream discharge (Q1 ):
Q1 = Q2 + B Δx ( Δy / Δt )
Q1 = 2200 + [900 m × 5 km × 1000 m/km × (10 cm × 0.01 m/cm)/ (3600 s)]
Q1 = 2325 m3/s. ANSWER.
|
Solve Problem 9-12 if the tributary contribution between the two points is estimated to be constant and equal to 225 m3/s.
|
A rough estimate of the discharge at a point 5 km upstream can be obtained by discretizing the equation of continuity with lateral inflow, Eq. 9-42, using an off-centered numerical scheme:
( Q2 - Q1 )/ Δx + ( A2 - A1 )/ Δt = qL
in which Q = discharge, A = flow area, Δt = time interval, Δx = space interval (reach length), and qL = lateral inflow, expressed as discharge per unit of channel length.
Since the channel width is constant, the change in flow area per time
interval is: ΔA = B Δy, in which B = channel width, and Δy = change in stage per time interval. Then:
(Q2 - Q1) / Δx + B (Δy / Δt) = qL
Solving for the upstream discharge (Q1):
Q1 = Q2 + B Δx ( Δy / Δt ) - qL ( Δx )
Since the lateral inflow is from tributary flow (225 m3/s), the total lateral inflow for the reach of length Δx is: QL = qL (Δx) = 225.
Therefore:
Q1 = 2200 + [900 m × 5 km × 1000 m/km × (10 cm × 0.01 m/cm)/ (3600 s)] - 225
Q1 = 2100 m3/s. ANSWER.
|
Determine if a flood wave with the following characteristics is a kinematic wave: time-of-rise tr = 6 h, bottom slope So = 0.015, average flow velocity Vo = 1.5 m/s, and average flow depth do = 3 m.
|
Using the kinematic wave applicability criterion (Eq. 9-44):
N1 = (6 h × 3600 s/h × 0.015 ×1.5 m/s) / (3 m) = 162.
Since 162 is greater than 85, this flood wave can be considered a kinematic wave. ANSWER.
|
Determine if a flood wave with the following characteristics is a diffusion wave: time-of-rise tr = 6 h, bottom slope So = 0.005, and average flow depth do = 3 m.
|
Using the diffusion wave applicability criterion (Eq. 9-60):
M1 = 6 h × 3600 s/h × 0.005 × (9.81 m/s2 / 3.0 m)1/2 = 195.
Since 195 is greater than 15, this wave can be considered a diffusion wave. ANSWER.
|
Program ONLINE_ROUTING_05
solves the Muskingum-Cunge method of flood routing, with routing parameters based on peak flow.
Test this program using Example 9-9 in the text.
|
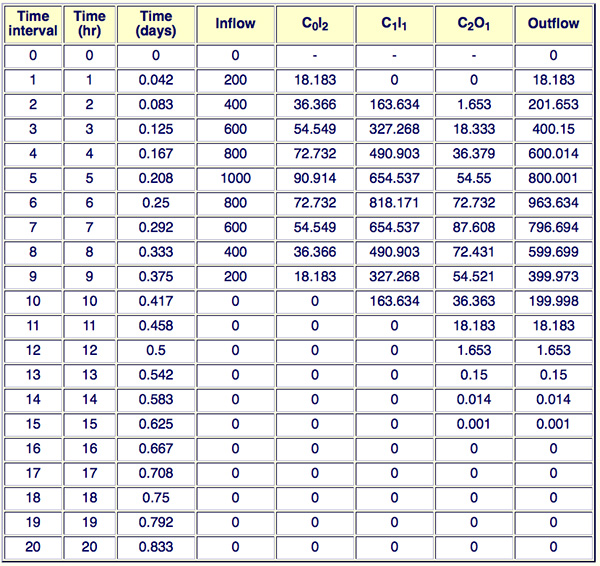
The results of ONLINE_ROUTING_05 are shown in the table below.
The peak outflow is 963.634 m3/s, and it occurs at 6 h. ANSWER.
|
Run ONLINE_ROUTING_05 using the following data: peak discharge = 500 m3/s, time-to-peak = 5 h, time base = 15 h, channel bed slope = 0.0008, flow area corresponding to the peak discharge = 200 m2, channel top width corresponding to the peak discharge = 50 m, rating exponent β = 1.65, reach length = 15 km, time interval Δt = 1 h.
Report peak outflow and time-to-peak.
|
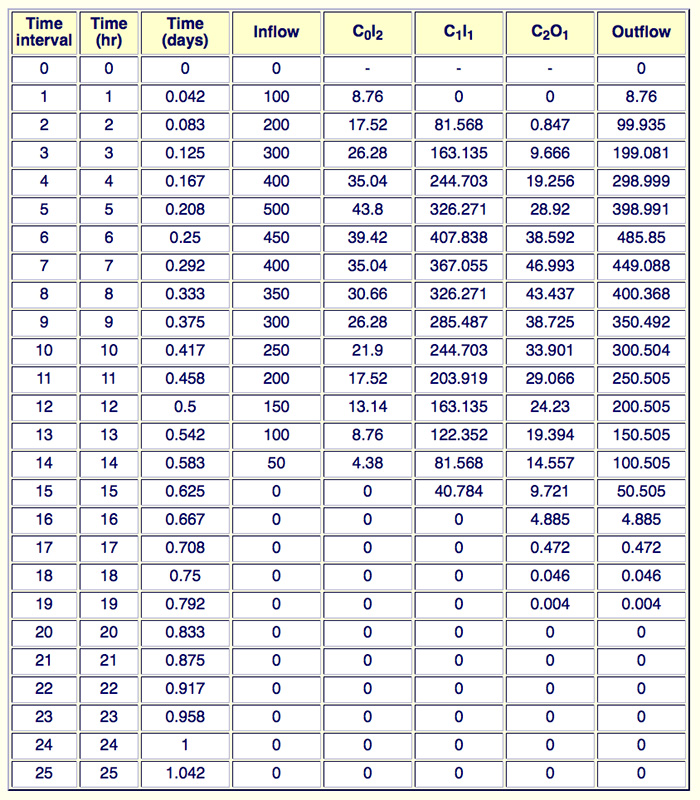
The results of flood routing with the Muskingum-Cunge method, using a triangular inflow hydrograph are summarised in the following table.
The peak outflow is 485.85 m3/s, and it occurs at 6 h. ANSWER.
|
Given the following inflow hydrograph to a stream channel reach, use ONLINE_ROUTING_05 to calculate the outflow hydrograph.
| Time (h) |
0 |
1 |
2 |
3 |
4 |
5 |
6 |
7 |
8 |
9 |
10 |
11 |
12 |
13 |
| Flow (m3/s) |
10 |
20 |
40 |
80 |
160 |
320 |
400 |
320 |
240 |
160 |
80 |
40 |
20 |
10 |
|
Channel bed slope = 0.001, flow area corresponding to the peak discharge = 800 m2, channel top width corresponding to the peak discharge = 35 m, rating exponent β = 1.6, reach length = 3 km, and time interval Δt = 1 h.
|
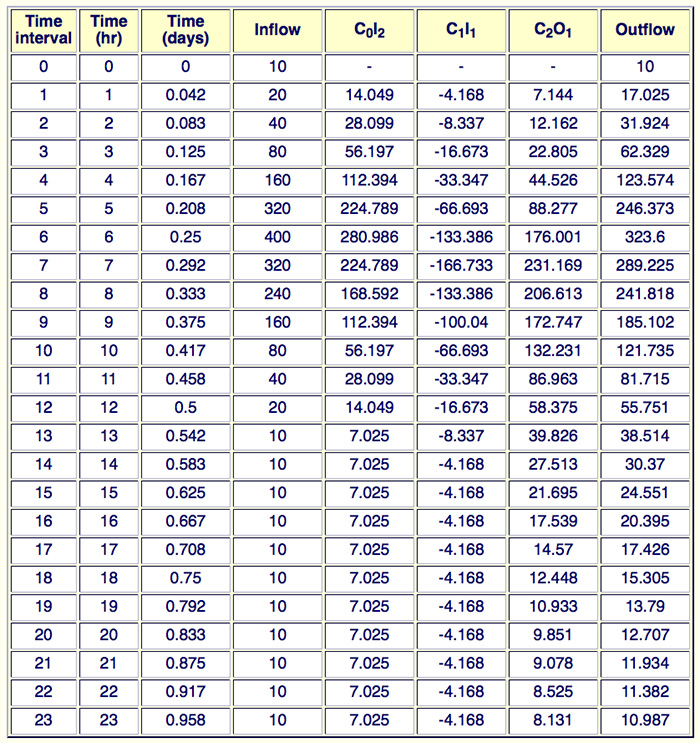
The results of flood routing with the Muskingum-Cunge method, are summarised in the following table.
The peak outflow is 323.6 m3/s, and it occurs at 6 h. ANSWER.
|
Given the following inflow hydrograph to a channel reach, calculate the outflow hydrographs for: (a) a reach length of 4 km, and (b) for a reach length of 5 km.
| Time (h) |
0 |
1 |
2 |
3 |
4 |
5 |
6 |
7 |
8 |
9 |
10 |
11 |
12 |
| Flow (m3/s ) |
5 |
8 |
12 |
20 |
28 |
33 |
29 |
22 |
19 |
13 |
8 |
6 |
5 |
|
Assume channel bed slope = 0.0015, flow area corresponding to the peak discharge = 42 m2,
channel top width corresponding to the peak discharge = 18 m, and rating exponent β = 1.5.
|
(a) For a reach length Δx = 4 km:
The mean velocity corresponding to the peak discharge is:
V = Qp / Ap = 33/42 = 0.7857 m/s
The wave celerity (Eq. 9-16) is: c = βV = 1.5 × 0.7857 = 1.1785 m/s
The Courant number (Eq. 9-69) is:
C = c Δt / Δx = 1.1785 m/s × 1 h × 3600 s/h / (4 km × 1000 m/km)
C = 1.0607
The reference discharge per unit width is:
qo = Qp / Tp = 33/18 = 1.833 m2/s
The cell Reynolds number (Eq. 9-71) is:
D = 1.833 m2/s / (0.0015 × 1.1785 m/s × 4 km × 1000 m/kn) = 0.2592
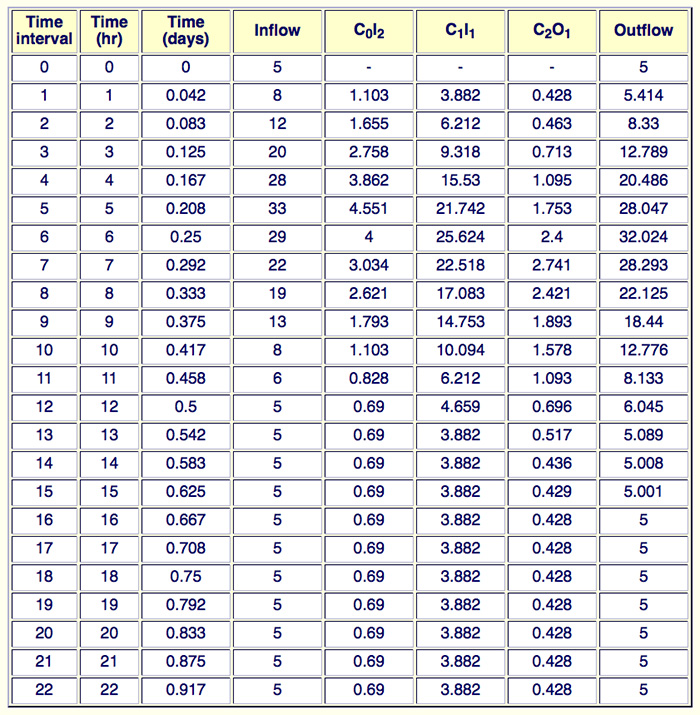
The routing computations are shown in the following table.
The peak outflow for the 4-km reach is: Qp = 32.024 m3/s occuring at 6 h. ANSWER.
|
|
(b) For a reach length Δx = 5 km:
The mean velocity corresponding to the peak discharge is:
V = Qp / Ap = 33/42 = 0.7857 m/s
The wave celerity (Eq. 9-16) is: c = βV = 1.5 × 0.7857 = 1.1785 m/s
The Courant number (Eq. 9-69) is:
C = c Δt / Δx = 1.1785 m/s × 1 h × 3600 s/h / (4 km × 1000 m/km)
C = 0.8485
The reference discharge per unit width is:
qo = Qp / Tp = 33/18 = 1.833 m2/s
The cell Reynolds number (Eq. 9-71) is:
D = 1.833 m2/s / (0.0015 × 1.1785 m/s × 5 km × 1000 m/kn) = 0.2074
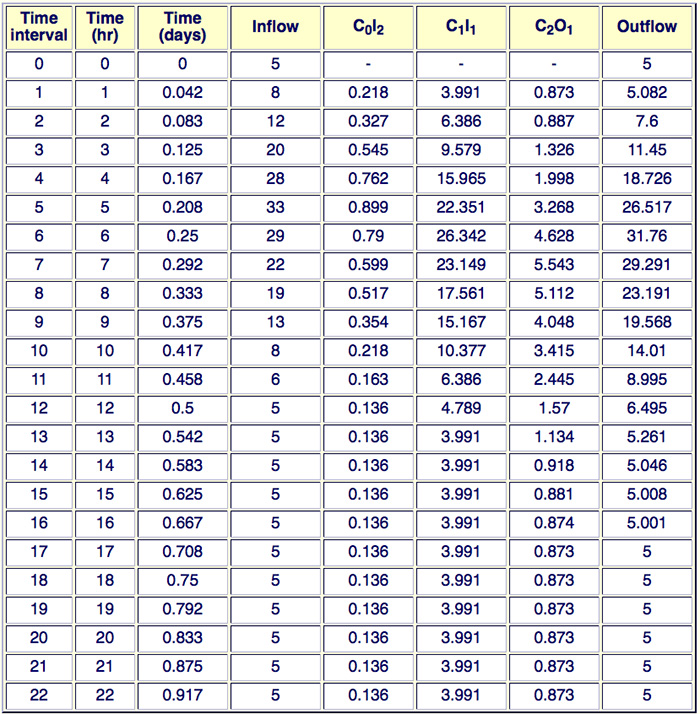
The routing computations are shown in the following table.
The peak outflow for the 5-km reach is 31.760 m3/s occuring at 6 h. When compared with the peak outflow for the 4-km reach (32.024, Problem 9-19(a)), it is confirmed that the flood wave continues to attenuate as it propagates downstream. ANSWER.
|
Calculate the hydraulic diffusivity for the following flow conditions: channel bed slope = 0.002, mean flow depth 4 m, mean flow velocity 2 m/s, and rating exponent β = 1.6. Compare the two cases: (a) without inertia, and (b) with inertia.
|
(a) Without inertia:
The reference flow per unit of channel width is: qo = Vd = 8 m2/s.
Therefore, using Eq. 9-59:
vh = 8 / (2 × 0.002) = 2000 m2/s. ANSWER.
(b) With inertia:
The hydraulic diffusivity without inertia is: vh = 2000 m2/s.
The Froude number of the reference flow (Eq. 9-79) is: Fo = 0.319.
With β = 1.6, using the coefficient of the right-hand side of Eq. 9-78:
vh = 2000 [1 - (1.6 - 1.0)2 × (0.319)2] = 1926.7 m2/s. ANSWER.
|
| http://enghydro.sdsu.edu |
|
150902 15:20 |
|
