QUESTIONS
-
What is the difference between hydrologic and hydraulic methods of catchment routing?
|
Hydrologic methods of catchment routing are based on the storage concept
and are spatially lumped to provide a runoff hydrograph at the catchment
outlet. Examples of hydrologic catchment routing methods are the
time-area method and the cascade of linear reservoirs.
Hydraulic methods use kinematic or diffusion waves to simulate surface runoff within a
catchment in a distributed context. Unlike hydrologic methods, hydraulic
methods can provide a runoff hydrograph inside the catchment.
|
What are catchment isochrones? How are they determined?
|
Catchment isochrones (or isochrone lines) are the loci of points of equal
travel time to the catchment outlet.
Catchment isochrones are determined by estimating
the time of concentration at several points inside the catchment, and
interpolating to find the contours of equal travel time.
|
How is time of concentration defined when using hydrographs generated by the time-area method?
|
In the absence of runoff diffusion, as would be the case of a hydrograph
calculated by the time-area method, the concentration time can be defined
as the difference between hydrograph time base and effective rainfall
duration. Alternatively, assuming that the point of inflection of the
receding limb of a measured hydrograph occurs at the same time as the end
of the hydrograph time base, the concentration time can be defined as the
difference between the time to point of inflection and the effective
rainfall duration.
|
When can the Clark unit hydrograph be considered synthetic? Explain.
|
The Clark unit hydrograph can be considered synthetic when the linear
reservoir storage constant, required to provide the necessary runoff
diffusion, is obtained by means of a regionally derived formula.
|
What is the difference between translation and diffusion? How are the time-area and rational methods related?
|
Translation (or concentration) can be interpreted as the movement of
water in a direction parallel to the channel bottom.
Diffusion (runoff diffusion, or channel storage) can be interpreted as
the movement of water in a direction perpendicular to the
channel bottom. Translation is a first-order process; diffusion is a
second-order process.
The time-area method is essentially an extension of the runoff
concentration principle used in the rational method. Unlike the rational
method, however, the time-area can account for the temporal variation of
rainfall intensity. The translation phase of the time-area method is
similar to the rational method in the absence of runoff diffusion. The
storage phase of the time-area method can take into account the effect of
runoff diffusion.
|
How can the linear reservoir storage coefficient be determined for runoff data?
|
To determine the linear reservoir routing coefficient from runoff data,
the differential equation of storage can be evaluated at the tail of a
measured (i.e., outflow) hydrograph, past the end of the translated-only
(i.e., inflow) hydrograph. Since at this point the inflow is equal to
zero:
and since S = KO, the following expression for K is obtained:
O
K = - ________
dO
_____
dt
|
and K can be evaluated from the outflow at a point past the end of the
translated-only hydrograph and its time rate of change.
Alternatively, K can be evaluated at the point of inflection of the
receding limb of a measured outflow hydrograph.
|
What is the principle behind the method of cascade of linear reservoirs used in catchment routing?
|
The principle behind the method of cascade of linear reservoirs is that
several reservoirs in series can provide enough diffusion so that
translation (runoff concentration) and storage (runoff diffusion) can be
simulated. In this way, a one-parameter routing method is extended to a
two-parameter routing method, while remaining within the computational
framework of the linear reservoir.
|
Why is it necessary to use two schemes in catchment routing using first-order kinematic wave techniques?
|
First-order kinematic wave schemes are conditionally stable, i.e., they
are stable only for a certain range of Courant numbers. For instance,
the forward-in-time, backward-in-space scheme is stable for Courant
numbers C < 1. Conversely, the forward-in-space, backward-in-time scheme
is stable for Courant numbers C > 1. To provide numerical stability for
all Courant numbers, it is necessary to alternate between the two
schemes.
|
Why is a kinematic wave solution using numerical techniques usually grid-dependent?
Why is the diffusion wave solution grid-independent?
|
A kinematic wave solution using numerical techniques is usually grid
dependent because of the creation of numerical diffusion which is not
specifically related to the chosen grid size. Therefore, the solution
varies with the grid size, i.e., it is grid dependent.
In the diffusion wave technique the physical and numerical diffusivities are
matched. Therefore, the solution does not vary appreciably with grid
size, i.e., it is grid independent.
|
PROBLEMS
A 45-km2 catchment has a 6-h time fo concentration with isochrones at 2-h intervals,
resulting in the following time-area histogram:
Time (h) |
0-2 |
2-4 |
4-6 |
Area (km2) |
9 |
21 |
15 |
|
Use the time-area method to calculate the outflow hydrograph from the following effective storm pattern:
Time (h) |
0-2 |
2-4 |
4-6 |
6-8 |
8-10 |
10-12 |
Effective rainfall (cm/h) |
0.5 |
1.0 |
2.0 |
3.0 |
1.0 |
0.5 |
|
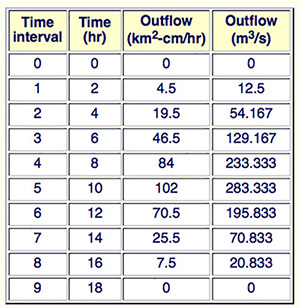
Use a spreadsheet. Verify your results with ONLINE ROUTING06.
|
The accumulated effective rainfall depth is:
(0.5 + 1.0 + 2.0 + 3.0 + 1.0 + 0.5) cm/h × 2 h = 16 cm.
The total runoff volume is: 45 km2 × 16 cm = 720 km2-cm = 7.2 hm3.
The calculations are shown in the following table.
Time
(h) |
Flows
(km2-cm/h) |
Outflow
(m3/s) |
| Effective rainfall (cm/h) |
| 0.5 |
1.0 |
2.0 |
3.0 |
1.0 |
0.5 |
Outflow |
| 0 |
0 |
|
|
|
|
|
0 |
0 |
| 2 |
4.5 |
0 |
|
|
|
|
4.5 |
12.50 |
| 4 |
10.5 |
9.0 |
0 |
|
|
|
19.5 |
54.17 |
| 6 |
7.5 |
21.0 |
18.0 |
0 |
|
|
46.5 |
129.17 |
| 8 |
0 |
15.0 |
42.0 |
27.0 |
0 |
|
84.0 |
233.33 |
| 10 |
|
0 |
30.0 |
63.0 |
9.0 |
0 |
102.0 |
283.33 |
| 12 |
|
|
0 |
45.0 |
21.0 |
4.5 |
70.5 |
195.83 |
| 14 |
|
|
|
0 |
15.0 |
10.5 |
25.5 |
70.83 |
| 16 |
|
|
|
|
0 |
7.5 |
7.5 |
20.83 |
| 18 |
|
|
|
|
|
0 |
0 |
0 |
| Sum |
|
|
|
|
|
|
360.0 |
|
|
The sum of outflow hydrograph ordinates is: 360 km2-cm/h.
The total runoff volume is: 360 km2-cm/h × 2 h = 720 km2-cm = 7.2 hm3.
The outflow hydrograph (in m3/s) is shown in the last column. ANSWER.
The results are confirmed by running ONLINE ROUTING06 as shown in the table below.
|
A 68-km2 catchment has a 4-h time of concentration with isochrones at 1-h intervals
resulting in the following time-area histogram:
Time (h) |
0-1 |
1-2 |
2-3 |
3-4 |
Area (km2) |
12 |
19 |
26 |
11 |
|
Use the time-area method to calculate the outflow hydrograph from the following storm:
Time (h) |
0-1 |
1-2 |
2-3 |
3-4 |
4-5 |
5-6 |
Total rainfall (cm/h) |
1 |
2 |
4 |
3 |
2 |
1 |
|
The runoff curve number is CN = 75. Use a spreadsheet. Verify your results with ONLINE ROUTING06.
|
The total rainfall depth is: P = 13 cm. With CN = 75, and R = 2.54 cm/in, the effective rainfall depth (i.e., runoff) (Eq. 5-9) is: Q = 6.465 cm.
Assuming φ between 1 and 2 cm/h:
[(2 - φ) × 1 + (4 - φ) × 1 + (3 - φ) × 1 + (2 - φ) × 1] = 6.465
From which: φ = 1.13 cm/h. The total and effective rainfall pattern is:
Time (h) |
0-1 |
1-2 |
2-3 |
3-4 |
4-5 |
5-6 |
Total rainfall (cm/h) |
1.00 |
2.00 |
4.00 |
3.00 |
2.00 |
1.00 |
Effective rainfall (cm/h) |
0 |
0.87 |
2.87 |
1.87 |
0.87 |
0.00 |
|
The accumulated effective rainfall depth is: 6.48 cm.
The total runoff volume is:
68 km2 × 6.48 cm = 440.64 km2-cm = 4.41 hm3.
The calculations are shown in the following table.
Time
(h) |
Flows
(km2-cm/h) |
Outflow
(m3/s) |
| Effective rainfall (cm/h) |
| 0.00 |
0.87 |
2.87 |
1.87 |
0.87 |
0.00 |
Outflow |
| 0 |
0 |
|
|
|
|
|
0 |
0 |
| 1 |
0 |
0 |
|
|
|
|
0 |
0 |
| 2 |
0 |
10.44 |
0 |
|
|
|
10.44 |
29.00 |
| 3 |
0 |
16.53 |
34.44 |
0 |
|
|
50.97 |
141.58 |
| 4 |
0 |
22.62 |
54.53 |
22.44 |
0 |
|
99.59 |
276.64 |
| 5 |
0 |
9.57 |
74.62 |
35.53 |
10.44 |
0 |
130.16 |
361.56 |
| 6 |
|
0 |
31.57 |
48.62 |
16.53 |
0 |
96.72 |
268.67 |
| 7 |
|
|
0 |
20.57 |
22.62 |
0 |
43.19 |
119.97 |
| 8 |
|
|
|
0 |
9.57 |
0 |
9.57 |
26.58 |
| 9 |
|
|
|
|
0 |
0 |
0 |
0 |
| Sum |
|
|
|
|
|
|
440.64 |
|
|
The sum of outflow hydrograph ordinates is 440.64 km2-cm/h.
The integration of the outflow hydrograph results in:
440.64 km2-cm/h × 1 h = 440.64 km2-cm ≅ 4.41 hm3 , which is the same as the total runoff volume. ANSWER.
The results are confirmed by running ONLINE ROUTING06 as shown in the table below.
|
An 82-km2 catchment has the following characteristics:
Time (h) |
0-1 |
1-2 |
2-3 |
3-4 |
4-5 |
5-6 |
Area (km2) |
14 |
22 |
29 |
17 |
0 |
0 |
Effective rainfall (cm/h) |
0.8 |
1.2 |
1.3 |
2.1 |
0.7 |
0.5 |
|
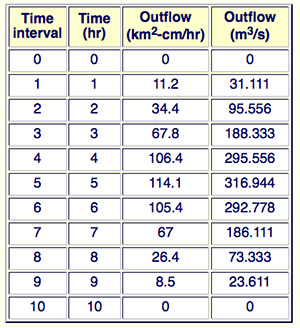
Using a spreadsheet, calculate the outflow hydrograph by the time-area method.
Verify your results with ONLINE ROUTING06.
|
The accumulated effective rainfall depth is: 6.6 cm.
The total runoff volume is:
82 km2 × 6.6 cm = 541.2 km2-cm = 5.412 hm3.
The results of the routing by the time-area method are shown in the following table.
Time
(h) |
Outflow
(m3/s) |
| 0 |
0 |
| 1 |
31.111 |
| 2 |
95.556 |
| 3 |
188.333 |
| 4 |
295.556 |
| 5 |
316.944 |
| 6 |
292.778 |
| 7 |
186.111 |
| 8 |
73.333 |
| 9 |
23.611 |
| 10 |
0 |
| Sum |
1503.333 |
|
The sum of outflow hydrograph ordinates is 1503.333 m3/s.
The integration of the outflow hydrograph results in:
1503.333 m3/s × 1 h = 1503.333 (m3/s)-h
1503.333 (m3/s)-h × 3600 s/h × 10-6 hm3/m3 = 5.412 hm3 , which is the same as the total runoff volume. ANSWER.
The results are confirmed by running ONLINE ROUTING06 as shown in the table below.
|
Use the Clark method with a spreadsheet to derive a 3-h unit hydrograph for a catchment with the following time-area diagram:
Time (h) |
0-3 |
3-6 |
6-9 |
9-12 |
Area (km2) |
57 |
72 |
39 |
15 |
|
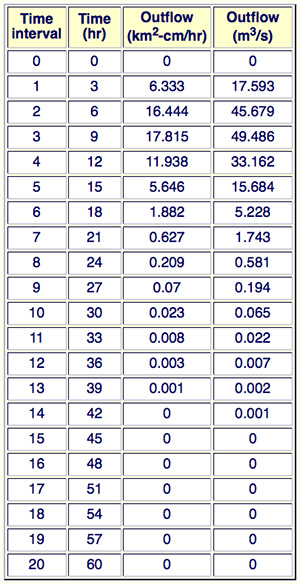
Use Δt = 3 h and K = 3 h. Verify your results with ONLINE ROUTING07.
|
Since Δt = 3 h, and K = 3 h: Δt /K = 1, and from Table 8-1, the linear reservoir-routing coefficients are the following: C0 = C1 = C2 = 1/3.
The unit runoff volume is:
(57 + 72 + 39 + 15) km2 × 1 cm = 183 km2-cm = 1.83 hm3.
Since the duration of the SI unit hydrograph (1 cm of runoff) is 3 h, the rainfall intensity is 1/3 cm/h. The calculations are shown in the following table.
Time
(h) |
Flows
(km2-cm/h) |
Outflow
(m3/s) |
| Effective rainfall (cm/h) |
| Ai × 1/3 cm/h |
C0 I2 |
C1 I1 |
C2 O1 |
Outflow |
| 0 |
0 |
- |
- |
- |
0 |
0 |
| 3 |
19 |
6.333 |
0 |
0 |
6.333 |
17.593 |
| 6 |
24 |
8.000 |
6.333 |
2.111 |
16.444 |
45.679 |
| 9 |
13 |
4.333 |
8.000 |
5.481 |
17.815 |
49.486 |
| 12 |
5 |
1.667 |
4.333 |
5.938 |
11.938 |
33.162 |
| 15 |
0 |
0 |
1.667 |
3.979 |
5.646 |
15.684 |
| 18 |
0 |
0 |
0 |
1.882 |
1.882 |
5.228 |
| 21 |
0 |
0 |
0 |
0.627 |
0.627 |
1.743 |
| 24 |
0 |
0 |
0 |
0.209 |
0.209 |
0.581 |
| 27 |
0 |
0 |
0 |
0.070 |
0.070 |
0.194 |
| 30 |
0 |
0 |
0 |
0.023 |
0.023 |
0.065 |
| 33 |
0 |
0 |
0 |
0.007 |
0.007 |
0.022 |
| 36 |
0 |
0 |
0 |
0.003 |
0.003 |
0.007 |
| Sum |
61 |
|
|
|
|
60.996 |
|
The unit runoff volume is obtained by integrating the unit hydrograph:
60.996 km2-cm/h × 3 h = 182.998 km2-cm = 1.83 hm3.
It is confirmed that this value is the same as that obtained from the catchment area. ANSWER.
The results are confirmed by running ONLINE ROUTING07 as shown in the table below.
|
Use the Clark method with a spreadsheet to derive a 1-h unit hydrograph for a catchment with the following time-area diagram:
Time (h) |
0-1 |
1-2 |
2-3 |
3-4 |
4-5 |
5-6 |
Area (km2) |
12 |
20 |
42 |
66 |
30 |
16 |
|
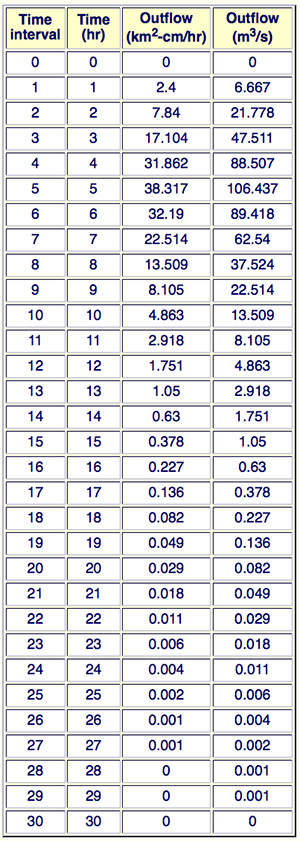
Use Δt = 1 h and K = 2 h. Verify your results with ONLINE ROUTING07.
|
Since Δt = 1 h, and K = 2 h: Δt /K = 1/2, and from Table 8-1, the linear reservoir-routing coefficient are the following:
C0 = 1/5; C1 = 1/5; C2 = 3/5
The unit runoff volume is:
(12 + 20 + 42 + 66 + 30 + 16) km2 × 1 cm = 186 km2-cm = 1.86 hm3
Since the duration of the SI unit hydrograph (1 cm of runoff) is 1 h, the rainfall intensity is 1 cm/h. The calculations are shown in the following table.
Time
(h) |
Flows
(km2-cm/h) |
Outflow
(m3/s) |
| Effective rainfall (cm/h) |
| Ai × 1 cm/h |
C0 I2 |
C1 I1 |
C2 O1 |
Outflow |
| 0 |
0 |
- |
- |
- |
0 |
0 |
| 1 |
12 |
2.40 |
0.00 |
0.00 |
2.40 |
6.67 |
| 2 |
20 |
4.00 |
2.40 |
1.44 |
7.84 |
21.78 |
| 3 |
42 |
8.40 |
4.00 |
4.70 |
17.10 |
47.51 |
| 4 |
66 |
13.20 |
8.40 |
10.26 |
31.86 |
88.51 |
| 5 |
30 |
6.00 |
13.20 |
19.11 |
38.32 |
106.44 |
| 6 |
16 |
3.20 |
6.00 |
22.99 |
32.19 |
89.42 |
| 7 |
0 |
0 |
3.20 |
19.31 |
22.51 |
62.54 |
| 8 |
0 |
0 |
0 |
13.50 |
13.51 |
37.52 |
| 9 |
0 |
0 |
0 |
8.10 |
8.10 |
22.51 |
| 10 |
0 |
0 |
0 |
4.86 |
4.86 |
13.51 |
| 11 |
0 |
0 |
0 |
2.92 |
2.92 |
8.11 |
| 12 |
0 |
0 |
0 |
1.75 |
1.75 |
4.86 |
| 13 |
0 |
0 |
0 |
1.05 |
1.05 |
2.92 |
| 14 |
0 |
0 |
0 |
0.63 |
0.63 |
1.75 |
| 15 |
0 |
0 |
0 |
0.38 |
0.38 |
1.05 |
| 16 |
0 |
0 |
0 |
0.23 |
0.23 |
0.63 |
| 17 |
0 |
0 |
0 |
0.14 |
0.14 |
0.38 |
| 18 |
0 |
0 |
0 |
0.08 |
0.08 |
0.23 |
| 19 |
0 |
0 |
0 |
0.05 |
0.05 |
0.14 |
| 20 |
0 |
0 |
0 |
0.03 |
0.03 |
0.08 |
| 21 |
0 |
0 |
0 |
0.02 |
0.02 |
0.05 |
| 22 |
0 |
0 |
0 |
0.01 |
0.01 |
0.03 |
| Sum |
186 |
|
|
|
185.96 |
|
|
The unit runoff volume is obtained by integrating the unit hydrograph:
185.96 km2-cm/h × 1 h = 185.96 km2-cm ≅ 1.86 hm3.
It is confirmed that this value is the same as that obtained from the catchment area. ANSWER.
The results are confirmed by running ONLINE ROUTING07 as shown in the table below.
|
Use the Clark method with a spreadsheet to derive a 2-h unit hydrograph for a catchment with the following time-area diagram:
Time (h) |
0-1 |
1-2 |
2-3 |
3-4 |
4-5 |
5-6 |
Area (km2) |
10 |
20 |
30 |
20 |
12 |
8 |
|
Use Δt = 1 h and K = 4 h. Verify your results with ONLINE ROUTING07.
|
Since Δt = 1 h, and K = 4 h: Δt /K = 1/4, and from Table 8-1, the linear reservoir-routing coefficient are the following:
C0 = 1/9; C1 = 1/9; C2 = 7/9
The unit runoff volume is:
(10 + 20 + 30 + 20 + 12 + 8) km2 × 1 cm = 100 km2-cm = 1.0 hm3
Since the duration of the SI unit hydrograph (1 cm of runoff) is 2 h, the rainfall intensity is 0.5 cm/h
Time
(h) |
Flows
(km2-cm/h) |
Outflow
(m3/s) |
| Effective rainfall (cm/h) |
| Ai × 0.5 cm/h |
Ai × 0.5 cm/h |
Sum |
C0 I2 |
C1 I1 |
C2 O1 |
Outflow |
| 0 |
0 |
0 |
0 |
- |
- |
- |
0 |
0 |
| 1 |
5 |
0 |
5 |
0.556 |
0.000 |
0.000 |
0.556 |
1.543 |
| 2 |
10 |
5 |
15 |
1.667 |
0.555 |
0.432 |
2.654 |
7.373 |
| 3 |
15 |
10 |
25 |
2.778 |
1.667 |
2.064 |
6.509 |
18.08 |
| 4 |
10 |
15 |
25 |
2.778 |
2.778 |
5.063 |
10.618 |
29.495 |
| 5 |
6 |
10 |
16 |
1.778 |
2.778 |
8.259 |
12.814 |
35.595 |
| 6 |
4 |
6 |
10 |
1.111 |
1.778 |
9.967 |
12.855 |
35.709 |
| 7 |
0 |
4 |
4 |
0.444 |
1.111 |
9.999 |
11.554 |
32.095 |
| 8 |
0 |
0 |
0 |
0 |
0.444 |
8.986 |
9.431 |
26.197 |
| 9 |
0 |
0 |
0 |
0 |
0 |
7.335 |
7.335 |
20.376 |
| 10 |
0 |
0 |
0 |
0 |
0 |
5.705 |
5.705 |
15.848 |
| 11 |
0 |
0 |
0 |
0 |
0 |
4.437 |
4.437 |
12.326 |
| 12 |
0 |
0 |
0 |
0 |
0 |
3.451 |
3.451 |
9.587 |
| 13 |
0 |
0 |
0 |
0 |
0 |
2.683 |
2.683 |
7.453 |
| 14 |
0 |
0 |
0 |
0 |
0 |
2.088 |
2.088 |
5.799 |
| 15 |
0 |
0 |
0 |
0 |
0 |
1.624 |
1.624 |
4.511 |
| 16 |
0 |
0 |
0 |
0 |
0 |
1.263 |
1.263 |
3.508 |
| 17 |
0 |
0 |
0 |
0 |
0 |
0.982 |
0.982 |
2.729 |
| 18 |
0 |
0 |
0 |
0 |
0 |
0.764 |
0.764 |
2.122 |
| 19 |
0 |
0 |
0 |
0 |
0 |
0.594 |
0.594 |
1.651 |
| 20 |
0 |
0 |
0 |
0 |
0 |
0.462 |
0.462 |
1.284 |
| 21 |
0 |
0 |
0 |
0 |
0 |
0.359 |
0.359 |
0.999 |
| 22 |
0 |
0 |
0 |
0 |
0 |
0.28 |
0.28 |
0.777 |
| 23 |
0 |
0 |
0 |
0 |
0 |
0.217 |
0.217 |
0.604 |
| 24 |
0 |
0 |
0 |
0 |
0 |
0.169 |
0.169 |
0.47 |
| 25 |
0 |
0 |
0 |
0 |
0 |
0.132 |
0.132 |
0.365 |
| 26 |
0 |
0 |
0 |
0 |
0 |
0.102 |
0.102 |
0.284 |
| 27 |
0 |
0 |
0 |
0 |
0 |
0.08 |
0.08 |
0.221 |
| 28 |
0 |
0 |
0 |
0 |
0 |
0.062 |
0.062 |
0.172 |
| 29 |
0 |
0 |
0 |
0 |
0 |
0.048 |
0.048 |
0.134 |
| 30 |
0 |
0 |
0 |
0 |
0 |
0 |
0 |
0 |
| Sum |
|
|
100 |
|
|
|
99.842 |
|
|
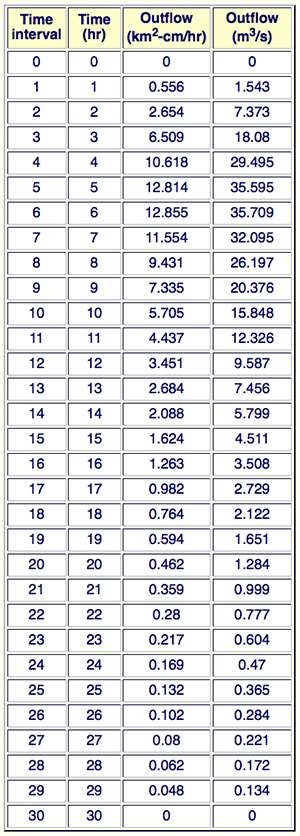
The results are confirmed by running ONLINE ROUTING07 as shown in the table below.
|
The 2-h unit hydrograph for a 92-km2 catchment is the following:
| Time (h) |
0 |
2 |
4 |
6 |
8 |
10 |
12 |
14 |
| Flow (m3/s) |
0 |
2.778 |
8.611 |
14.333 |
19.433 |
21.938 |
20.942 |
15.897 |
| Time (h) |
16 |
18 |
20 |
22 |
24 |
26 |
28 |
30 |
| Flow (m3/s) |
9.538 |
5.722 |
3.433 |
2.061 |
1.236 |
0.742 |
0.444 |
0.267 |
|
Given the following time-area diagram, what is the linear reservoir storage constant in the Clark method?
Time (h) |
0-2 |
2-4 |
4-6 |
6-8 |
8-10 |
10-12 |
Area (km2) |
10 |
15 |
18 |
21 |
16 |
12 |
|
|
The time of concentration is: tc = 12 h.
The effective rainfall duration is: tr = 2 h.
The time base of the translated-only hydrograph (Eq. 10-1) is:
Tb = tc + tr = 14 h.
Therefore, the evaluation of K can be based on Eq. 10-4, using two consecutive hydrograph ordinates after 14 h. Using the ordinates at 14 and 16 h:
K = - [Ō/ (dO/dt)]
K = - [(15.897 + 9.538)/2] / [(9.538 - 15.897)/ 2 h] = 4 h. ANSWER.
|
A 1-h unit hydrograph derived from measured data has the following ordinates:
| Time (h) |
0 |
1 |
2 |
3 |
4 |
5 |
6 |
7 |
| Flow (m3/s) |
0 |
7 |
22 |
48 |
60 |
90 |
74 |
47 |
| Time (h) |
|
8 |
9 |
10 |
11 |
12 |
13 |
14 |
| Flow (m3/s) |
|
28 |
17 |
10 |
6 |
4 |
3 |
2 |
|
Assuming a time of concentration tc = 6 h, calculate the linear reservoir storage constant in the Clark method.
|
The time of concentration is: tc = 6 h.
The effective rainfall duration is: tr = 1 h.
The time base of the translated-only hydrograph (Eq. 10-4) is:
Tb = tc + tr = 7 h.
Therefore, the evaluation of K can be based on Eq. 10-4, using two consecutive hydrograph ordinates after 7 h. Alternatively, the end of the translated-only hydrograph can be assumed to occur at the point of inflection on the receding limb of the measured hydrograph, which can be readily identified at 7 h.
Using Eq. 10-4 and the ordinates at 7 and 8 h:
K = - [(47 + 28)/2] / [(28 - 47)/ 1 h] = 1.97 h.
Since this is a unit hydrograph derived from measured data, it may be appropriate to average several values of K computed at the tail of the hydrograph.
Accordingly, using the ordinates at 8 and 9 h: K = 2.04 h.
Using the ordinates at 9 and 10 h: K = 1.92 h.
Using the ordinates at 10 and 11 h: K = 2.0 h. The average of four calculations is: K = 1.98 h, say K = 2 h. ANSWER.
|
Using ONLINE ROUTING08,
route the effective rainfall hyetograph of Example 10-3
(with time interval Δt = 6 h using:
(a) K = 12 h and N = 4; and (b) K = 18 h and N = 3.
|
The calculations are shown in the following table.
Time
(h) |
Outflow
(m3/s) |
| K = 12 h; N = 4 |
K = 18 h; N = 3 |
| 0 |
0 |
0 |
| 6 |
1.778 |
3.239 |
| 12 |
18.489 |
29.617 |
| 18 |
79.644 |
107.098 |
| 24 |
206.080 |
233.935 |
| 30 |
379.193 |
374.072 |
| 36 |
549.125 |
489.028 |
| 42 |
670.129 |
560.611 |
| 48 |
723.116 |
589.121 |
| 54 |
713.299 |
582.541 |
| 60 |
657.812 |
550.891 |
| 66 |
575.947 |
503.530 |
| 72 |
483.973 |
448.089 |
| 78 |
393.396 |
390.243 |
| 84 |
311.134 |
333.888 |
| 90 |
240.497 |
281.460 |
| 96 |
182.314 |
234.293 |
| 102 |
135.916 |
192.929 |
| 108 |
99.866 |
157.381 |
| 114 |
72.452 |
127.329 |
| 120 |
51.976 |
102.268 |
|
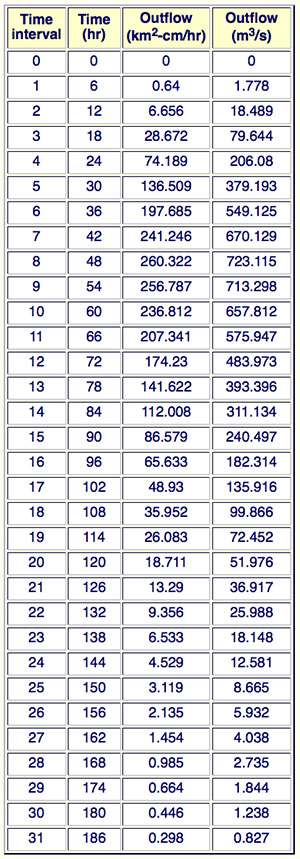
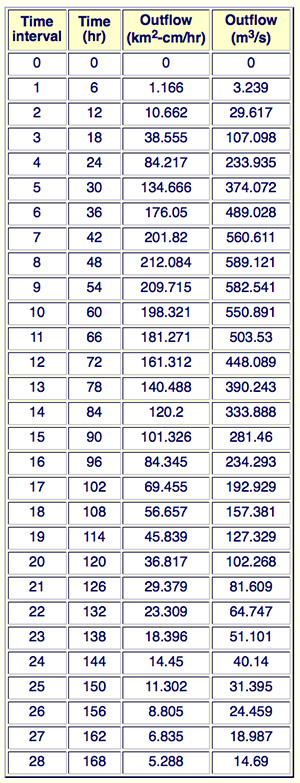
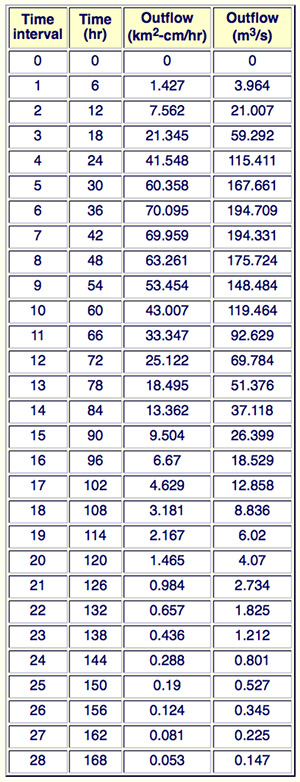
The results are confirmed by running ONLINE ROUTING08 as shown in the table below.
The results are confirmed by running ONLINE ROUTING08 as shown in the table below.
|
Use ONLINE ROUTING08
to route the following storm hyetograph through a 535-km2 catchment.
| Time (h) |
0-6 |
6-12 |
12-18 |
18-24 |
| Effective rainfall depth (cm) |
1.0 |
1.5 |
2.5 |
1.2 |
| Effective rainfall depth (cm/hr) |
0.1667 |
0.2500 |
0.4167 |
0.2000 |
|
Set K = 12 h and N = 3. Report peak outflow and time-to-peak.
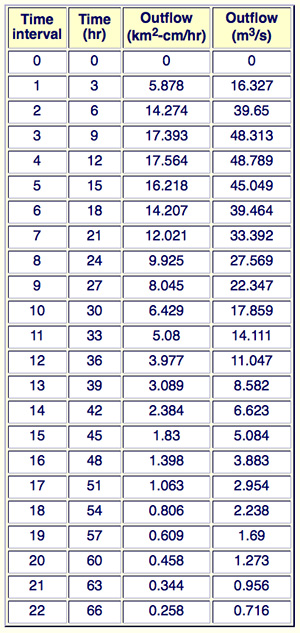
Using the method of cascade of linear reservoirs, derive a 3-h unit hydrograph for a 432-km2 basin.
Assume Δt = 3 h, K = 9 h and two reservoirs (N = 2).
Verify the results with ONLINE ROUTING08.
|
The basin area is 432 km2. The calculations follow Example 10-3, with Δt= 3 h and K = 9 h, leading to C = Δt/K = 1/3, and to the routing coefficients (Eqs. 10-7 and 10-8): C1 = 1/7; and C2 = 5/7.
The routing equation is Eq. 10-10. The results of the routing with 2 linear reservoirs (N = 2) are summarized in the following table.
|
t
(h) | Outflow
(m3/s) |
| 0 | 0.000 |
| 3 | 16.327 |
| 6 | 39.650 |
| 9 | 48.313 |
| 12 | 48.789 |
| 15 | 45.049 |
| 18 | 39.464 |
| 21 | 33.392 |
| 24 | 27.569 |
| 27 | 22.347 |
| 30 | 17.859 |
| 33 | 14.111 |
| 36 | 11.047 |
| 39 | 8.582 |
| 42 | 6.623 |
| 45 | 5.084 |
| 48 | 3.883 |
| 51 | 2.954 |
| 54 | 2.238 |
| 57 | 1.690 |
| 60 | 1.273 |
| 63 | 0.956 |
| 66 | 0.716 |
| 69 | 0.536 |
| 72 | 0.400 |
| 75 | 0.298 |
| 78 | 0.221 |
| 81 | 0.164 |
| 84 | 0.122 |
| 87 | 0.090 |
| 90 | 0.067 |
| 93 | 0.049 |
| 96 | 0.036 |
| 99 | 0.027 |
| 102 | 0.020 |
| 105 | 0.015 |
| 108 | 0.011 |
| 111 | 0.008 |
| 114 | 0.006 |
| 117 | 0.004 |
| 120 | 0.003 |
| 123 | 0.002 |
| 126 | 0.002 |
| 129 | 0.001 |
| 132 | 0.001 |
| Sum | 399.999 |
|
The sum of ouflow hydrograph ordinates is 399.999, or 400 m3/s.
The integration of the outflow hydrograph leads to:
400 m3/s × 3 h × 3600 s/h = 4,320,000 m3, or 432 km2-cm, i.e., 1 cm of runoff depth uniformly distributed over the basin area. ANSWER.
The results are confirmed by runnung ONLINE ROUTING08 as shown in the table below.
|
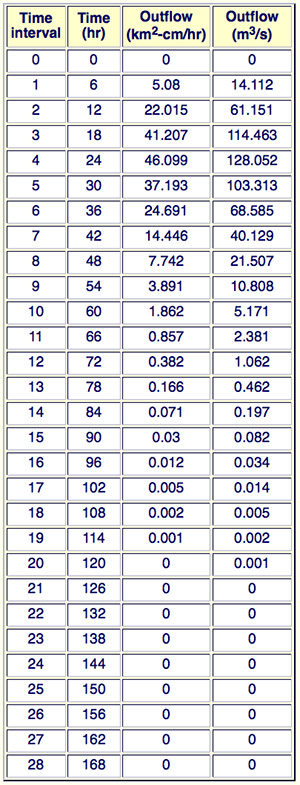
Using the method of cascade of linear reservoirs, derive a 6-h unit hydrograph for a 1235-km2 basin.
Assume Δt = 6 h, K = 6 h and N = 4.
Verify the results with ONLINE ROUTING08.
|
With catchment (basin) area = 1235 km2 ; time interval Δt = 6 h; one (1) rainfall increment of 1 cm depth (unit hydrograph); reservoir storage constant K = 6 h; and number of linear reservoirs N = 4. The results are summarized in the following table.
Time
(h) |
Outflow
(m3/s) |
| 0 |
0.000 |
| 6 |
14.112 |
| 12 |
61.151 |
| 18 |
114.463 |
| 24 |
128.052 |
| 30 |
103.313 |
| 36 |
68.585 |
| 42 |
40.129 |
| 48 |
21.507 |
| 54 |
10.808 |
| 60 |
5.171 |
| 66 |
2.381 |
| 72 |
1.062 |
| 78 |
0.462 |
| 84 |
0.197 |
| 90 |
0.082 |
| 96 |
0.034 |
| 102 |
0.014 |
| 108 |
0.005 |
| 114 |
0.002 |
| 120 |
0.001 |
| Sum |
571.531 |
|
The integration of the outflow hydrograph leads to:
571.531 m3/s × 6 h × 3600 s/h = 12,345,069 m3 ≅ 1235 km2-cm, i.e.,
1 cm or runoff depth uniformly distributed over the basin area. ANSWER.
The results are confirmed by runnung ONLINE ROUTING08 as shown in the table below.
|
Derive Eq. 10-16.
|
The discretization of Eq. 9-43 in a forward-in-time, backward-in-space linear scheme leads to:
Q j+1n+1 - Q j+1n Q j+1n+1 - Q j n
___________________ + c _________________ = cqL
Δt Δx
in which c = βV. Solving for the unknown discharge:
Q j+1 n+1 =
C Q j n + (1- C) Qj+1n + C QL
in which: C = c ( Δt / Δx ); and QL = qL Δx
Therefore:
Q j+1 n+1 =
C1 Q j n + C2 Qj+1 n + C3 QL
in which C1 = C ; C2 = 1 - C; C3 = C. ANSWER.
|
Derive Eq. 10-17.
|
The discretization of Eq. 9-43 in a forward-in-space, backward-in-time linear scheme leads to:
Q jn+1 - Q jn Q j+1n+1 - Q j n+1
___________________ + c _________________ = cqL
Δt Δx
in which c = βV. Solving for the unknown discharge:
Q j+1 n+1 =
[(C- 1)/ C] Q j n+1 + (1/C) Qj n + QL
in which: C = c ( Δt / Δx ); and QL = qL Δx
Therefore:
Q j+1 n+1 =
C0 Q j n+1 + C1 Qj n + C3 QL
in which C0 = [(C - 1)/ C] ; C1 = 1/C; C3 = 1. ANSWER.
|
Derive Eq. 10-20.
|
The discretization of Eq. 9-43 in a way that parallels the Muskingum method, centering the spatial derivative and offcentering the temporal derivative by means of a weighting factor X leads to Eq. 9-61, but with a right-hand side equal to cqL, in which c = βV.
Multiplying both sides by 2Δt results in Eq. 9-62, with routing coefficients given by Eqs. 9-63 to 9-65, but with the addition of a lateral inflow term on the right-hand side as follows:
2Δt cqL
_________________________
2(1- X) + c (Δt / Δx)
Since C = c (Δt / Δx): c Δt = C Δx, and qLΔx = QL, and using Eq. 9-72, the lateral inflow term is C3QL, in which the routing coefficient C3 is:
2C
C3 = _____________ ANSWER.
1+ C + D
|
| http://enghydro.sdsu.edu |
|
150902 17:30 |
|
