USGS website registration
- Go to USGS web page: https://earthexplorer.usgs.gov/
- Click on Register tab.
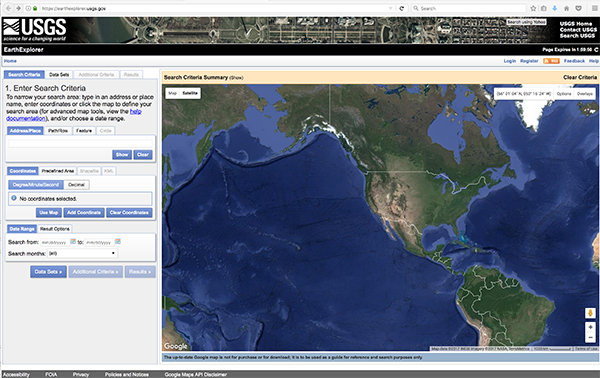
Fig. 1 USGS virtual plataform: Earth Explorer.
- Complete the User Credentials of User Registration.
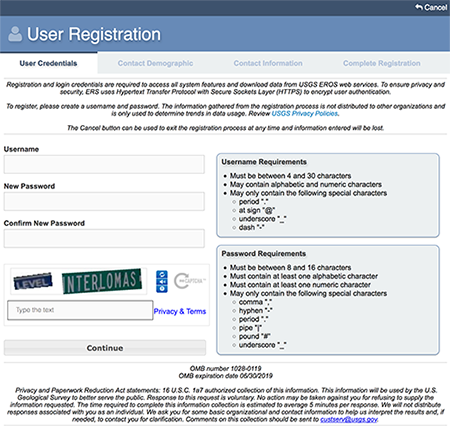
Fig. 2 User credentials of user registration.
- Complete the Contact Demographic of User Registration.
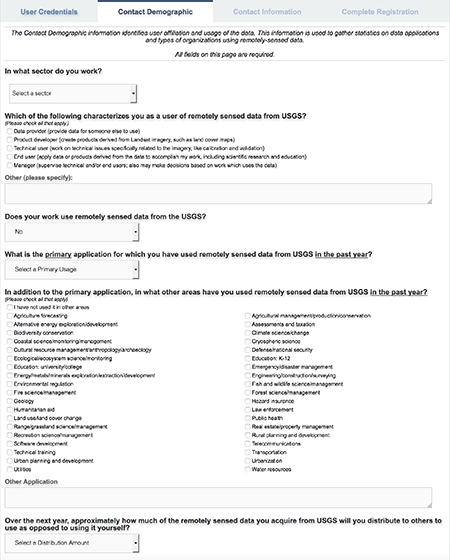
Fig. 3 Contact demographic of user registration.
- Complete de Contact Information of User Registration.
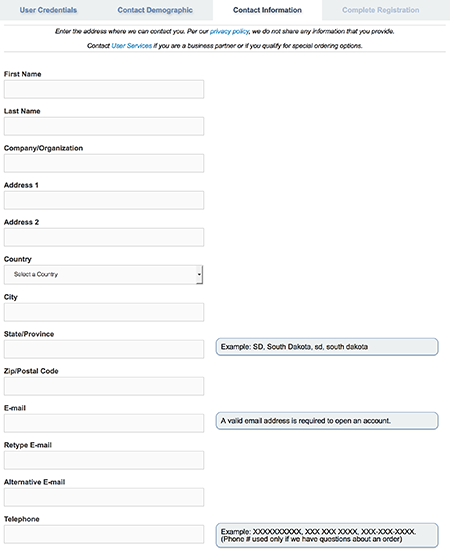
Fig. 4 Contact information of user registration.
- Clic on Submit Registration.
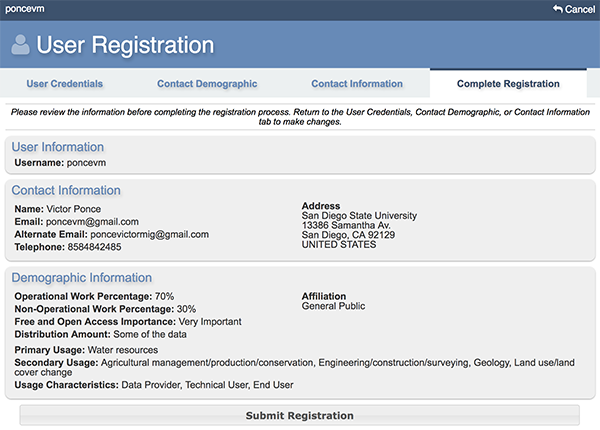
Fig. 5 Submit registration.

Fig. 6 Registration complete.
- Clic on USGS/EROS email confirmation link in personal email.
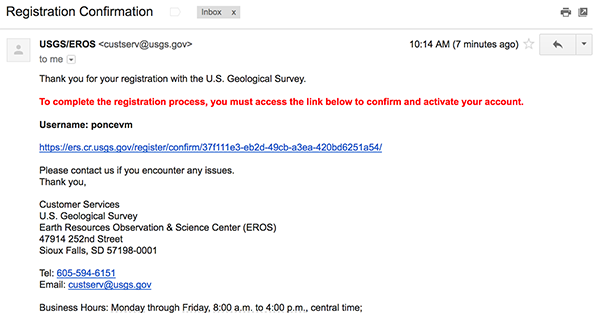
Fig. 7 Registration confirmation.
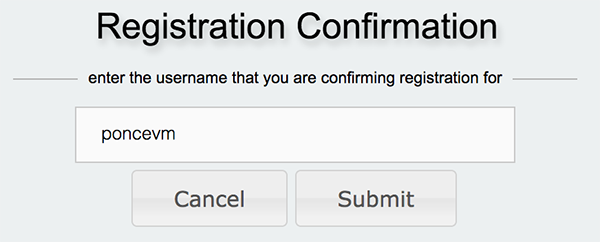
Fig. 8 Registration confirmation username.
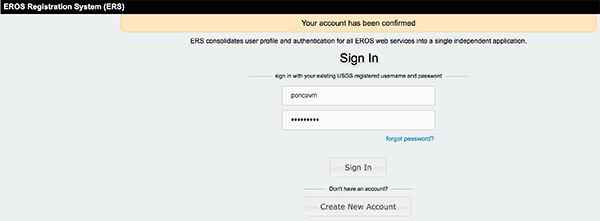
Fig. 9 Confirmation account.
Fig. 10 Registration user.
Identification of study area coordinates system with Google Earth
- Go to: Google Earth virtual plataform.
- Clic on Search.
- Input Salar De Uyuni Desert, we can identified the system coordinate WGS 1984 Zone 19 S.
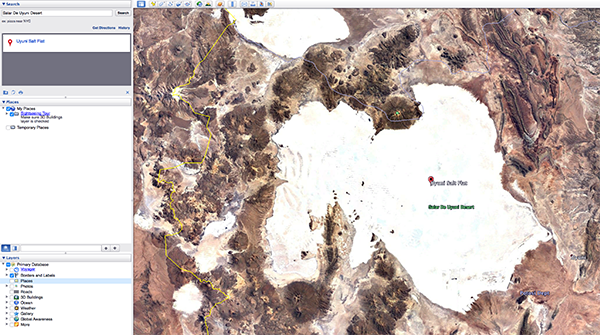
Fig. 11 Study area location.
- Identified study area in Earth Explorer virtual plataform.
- Clic points around study area and created a red polygon and input the Date range, only with the mouse.
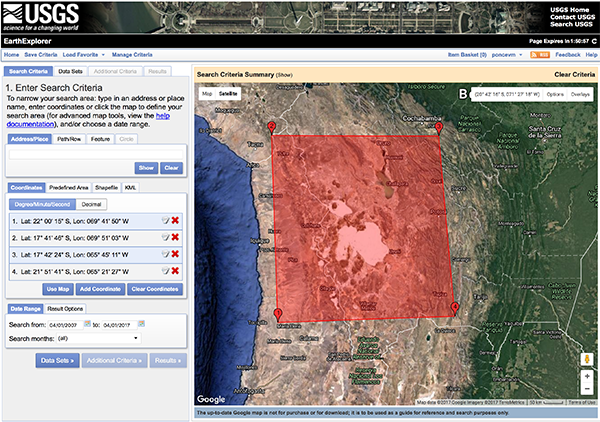
Fig. 12 Study area red polygon.
- Clic on Data Sets and choose Nasa LPDAAC Collections - ASTER Collections -
ASTER Global DEM.
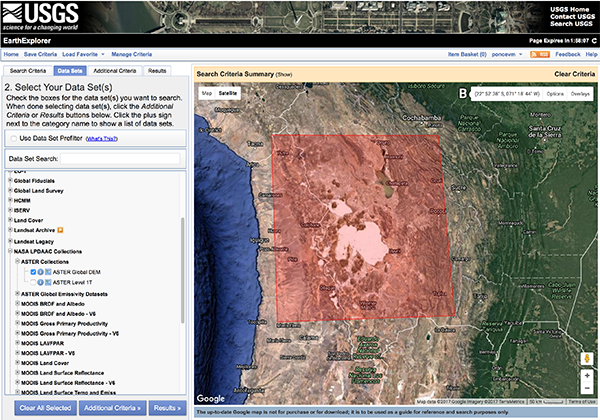
Fig. 13 Data sets options.
- Clic on Results and choose a set of DEMs for start downloading.
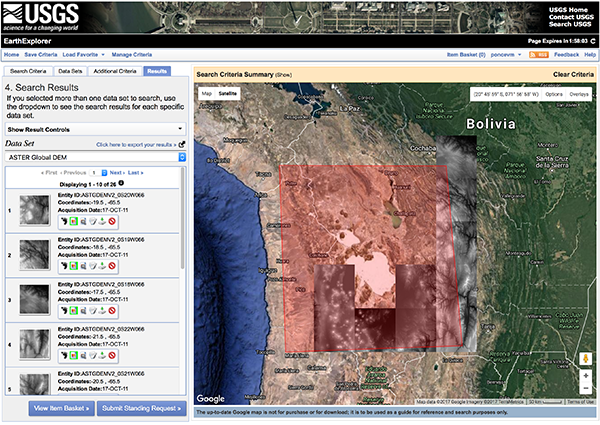
Fig. 14 Previsualization of DEMs.
- Choose each DEM, clic on I agree and start download.
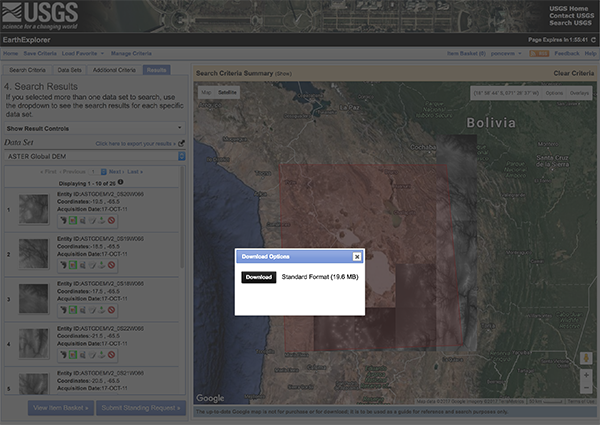
Fig. 15 Download DEM.
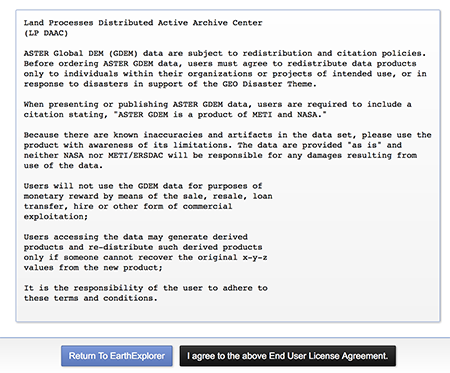
Fig. 16 Clic on I agree option.
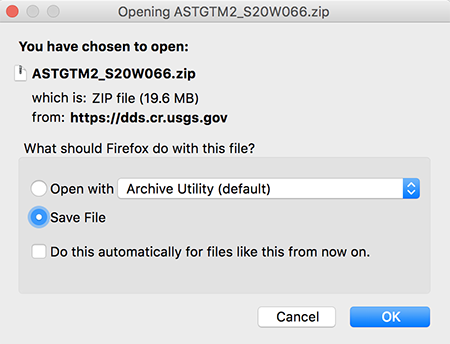
Fig. 17 Clic on OK for start download.
- Review all (.zip) download files and only work with extension files (...dem.tif).
- Save all DEMs in the same folder.
Using archydro tool with GIS
- Open ArcMap and a new blank map.
- Do not open an existing map file. Remember to save your work frequently. Save map (.mxd).
- Load all DEMs into ArcMap
- Go to File > Add Data> Add Data, select your DEM folder (Upper left). If asked to build pyramids say Yes.
- Select the study area coordinate system
- Right clic on Layers> Properties> Coordinate System, chose Projected Coordinate Systems - UTM - WGS 1984 - Southern Hemisphere - WGS 1984 UTM Zone 19S. Then clic on Apply.
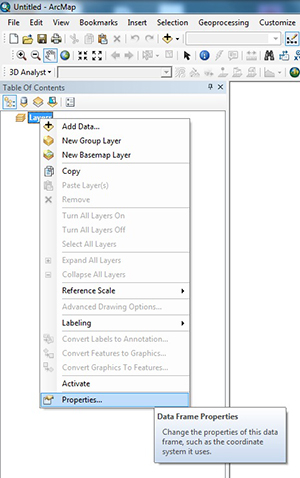
Fig. 18 Right clic on Layers and chose Properties.
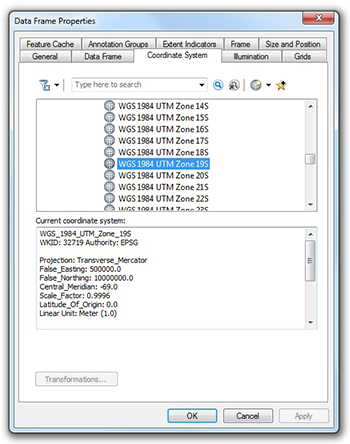
Fig. 19 Select study area coordinate system.
- Turn on Arc Tool Box
- Click on icon Arc Tool Box that is a red box.
- Click Projections and Transformations > Raster > Check Project Raster > Input each DEM file for working in UTM coordinates.
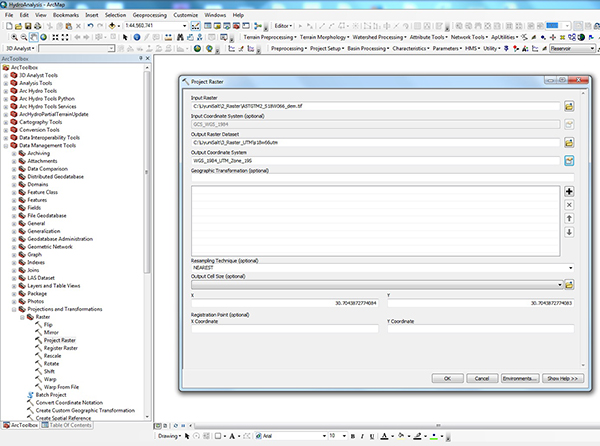
Fig. 20 Project raster from geografic coordinates to UTM coordinates.
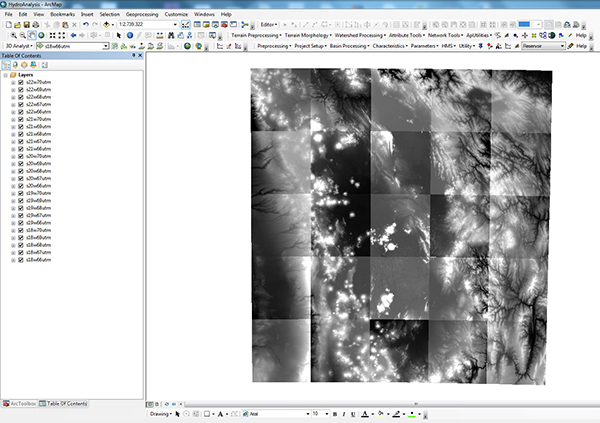
Fig. 21 View of all DEMs.
- Click Data Management Tools > Raster > Raster Dataset > Check Mosaic To New Raster > Input all DEMs in UTM coordinate system to join us in only one (1) Full DEM.
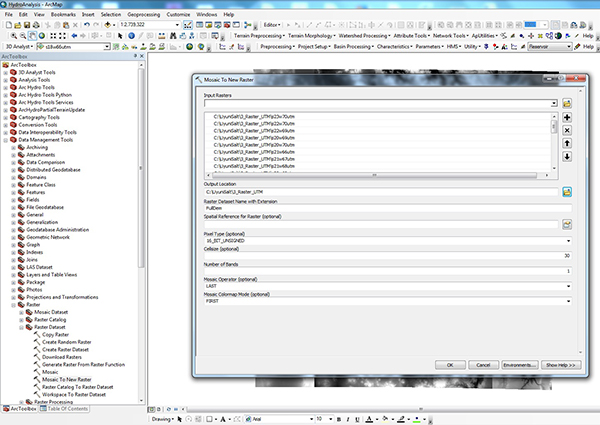
Fig. 22 Using Mosaic To New Raster.
- Turn on Arc Hydro Tool
- Right clic outside ArcMap Tools > Check Arc Hydro Tools.
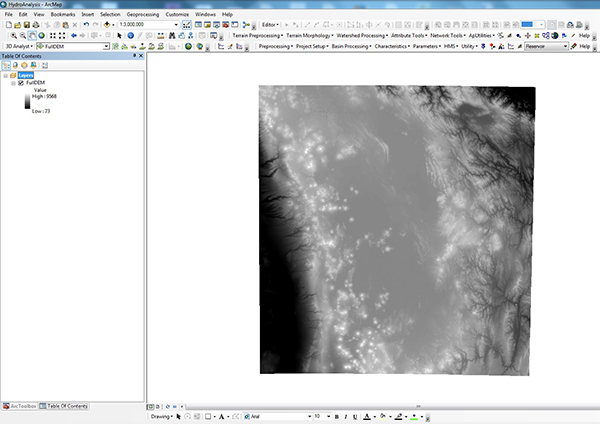
Fig. 23 View of full DEM.
- Clic ApUtilities > Set Target Locations.

Fig. 24 Set Target Locations.
- Right clic outside ArcMap Tools > Check Arc Hydro > HydroConfig.
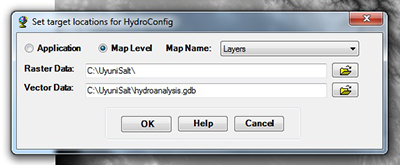
Fig. 25 Hydro configuration.
- Terrain Preprocesing
- Clic on DEM Manipulation > Fill Sinks, for correcting imperfections over terrain.
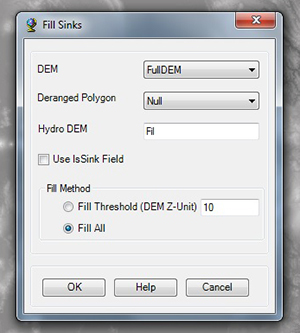
Fig. 26 Fill sinks options.
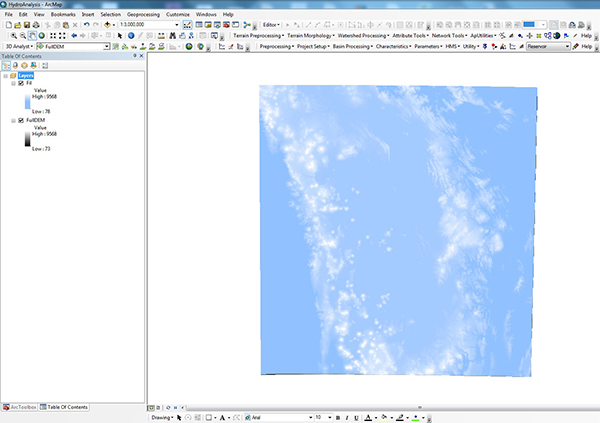
Fig. 27 Fill sinks raster.
- Clic on Flow Direction, show different colors pixels for generate a lot of flow directions.
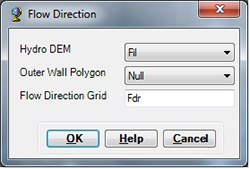
Fig. 28 Flow direction options.
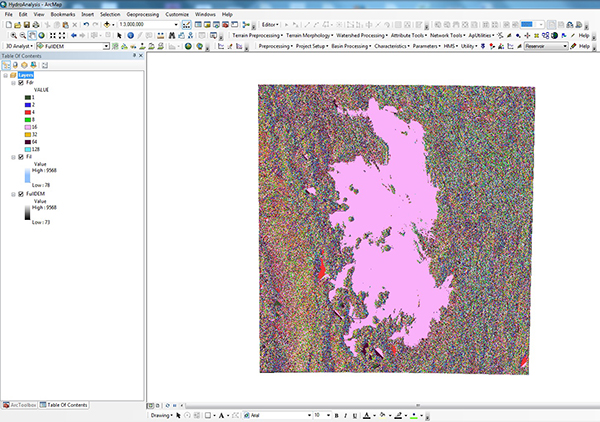
Fig. 29 Flow direction raster.
- Clic on Flow Accumulation, select the longer streams channel from flow direction raster.
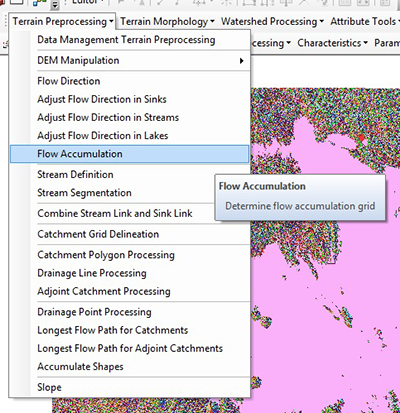
Fig. 30 Flow accumulation.
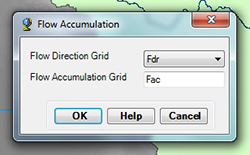
Fig. 31 Flow accumulation options.
- Clic on Stream Definition, define the stream density since an area boundary or pixels amount.
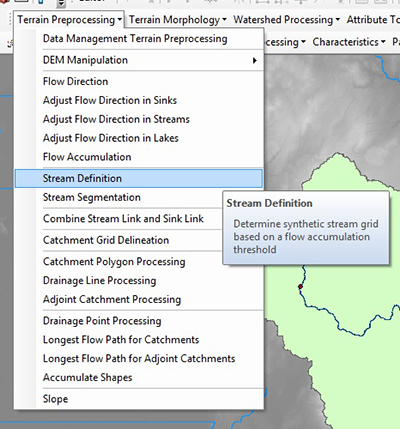
Fig. 32 Stream definition.
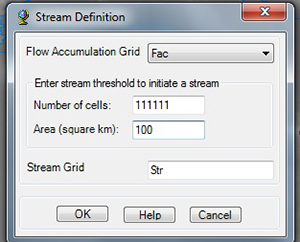
Fig. 33 Stream definition options.
- Clic on Stream Segmentation, divide the stream channels in each intersection.
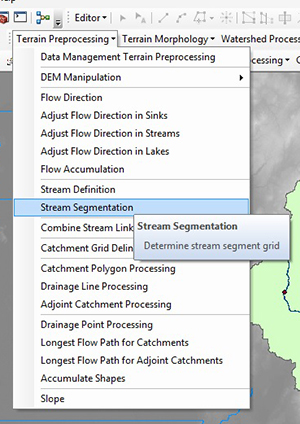
Fig. 34 Stream segmentation.
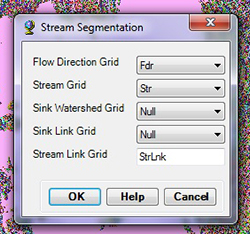
Fig. 35 Stream segmentation options.
- Clic on Catchment Grid Delineation, generate a delimitation catchments since stream segmentation and flow direcction rasters.
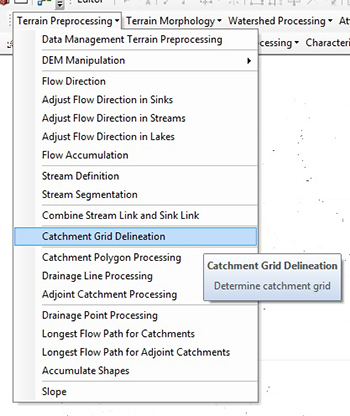
Fig. 36 Catchment grid delineation.
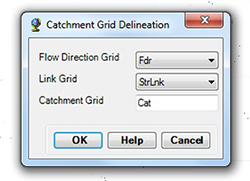
Fig. 37 Catchment grid delineation options.
- Clic on Catchment Polygon Processing, convert catchment grid delineation raster in a shapefile polygon.
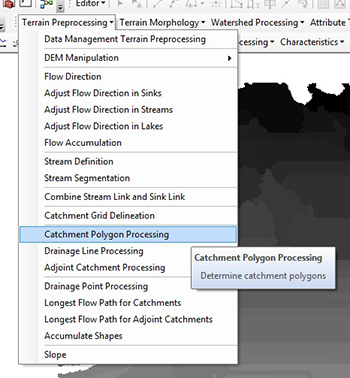
Fig. 38 Catchment polygon processing.
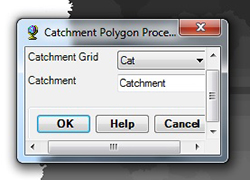
Fig. 39 Catchment polygon processing options.
- Clic on Drainage Line Processing, introduce the stream channel shapefile since stream segmentation and flow direcction rasters.
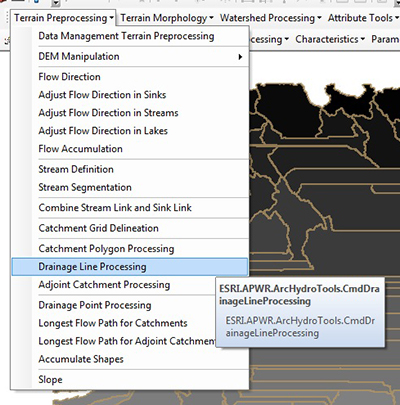
Fig. 40 Drainage line processing.
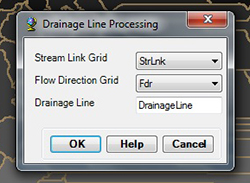
Fig. 41 Drainage line processing options.
- Clic on Adjoint Catchment Processing, adjoint neighborhood catchments with the same outlet point.
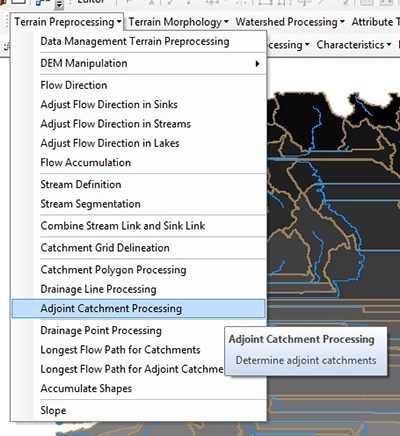
Fig. 42 Adjoint catchment processing.
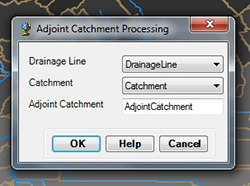
Fig. 43 Adjoint catchment processing options.
- Clic on Slope, convert DEM to slope raster.
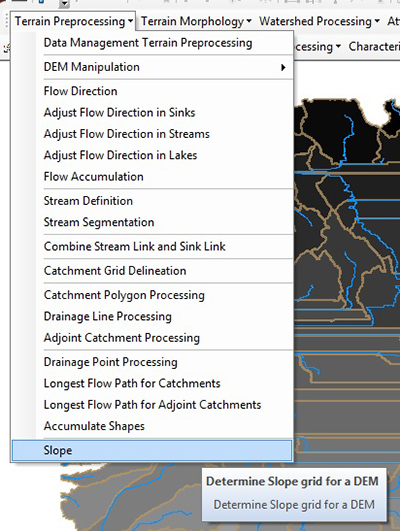
Fig. 44 Slope.
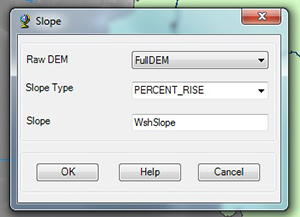
Fig. 45 Slope options.
- Clic on DEM Manipulation > Fill Sinks, for correcting imperfections over terrain.
- Introduce a watershed point
- Click on Batch Point Generation, the yellow "X" icon at the left side of Archydro Tool.
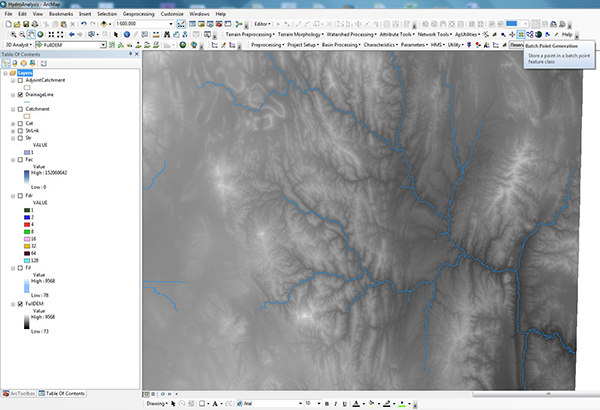
Fig. 46 Select batch point generation.
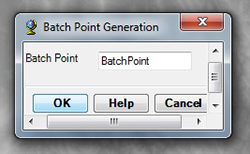
Fig. 47 Batch point generation command.
- Zoom in near the stream definition raster and input a clic in the interest watershed point.
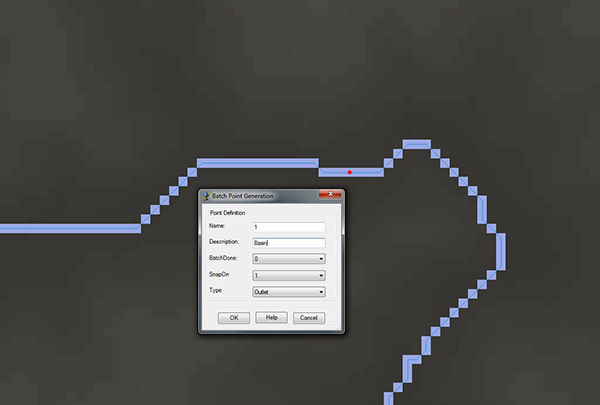
Fig. 48 Batch point generation options.
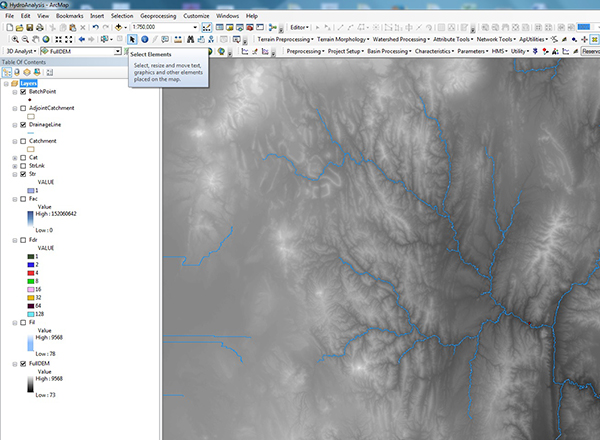
Fig. 49 Desactivate batch point generation.
- Click on Batch Point Generation, the yellow "X" icon at the left side of Archydro Tool.
- Using Watershed Processing
- Clic on Batch Watershed Delineation, delimitate the interest watershed.
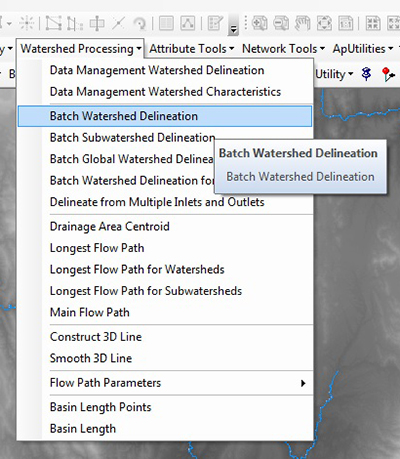
Fig. 50 Batch watershed delineation command.
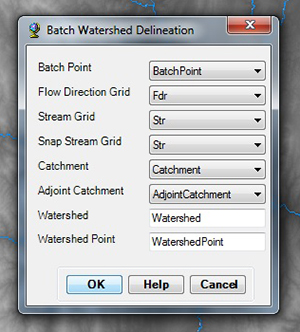
Fig. 51 Batch watershed delineation options.
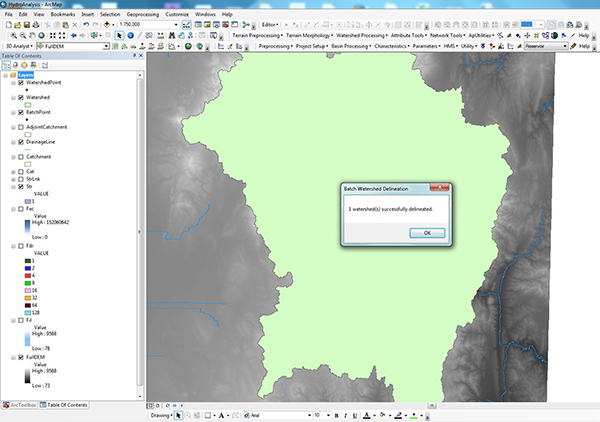
Fig. 52 View of watershed.
- Clic on Longest Flow Path, introduce the hydraulic length principal channel.
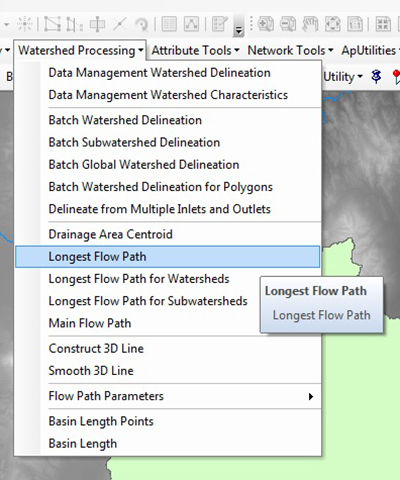
Fig. 53 Longest flow path command.
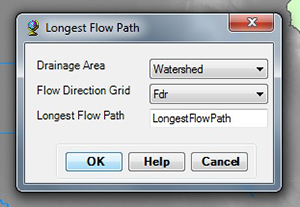
Fig. 54 Longest flow path options.
- Clic on Construct 3D Line, select the longest flow path like 2D shapefile and DEM raster for calculating topographical data.
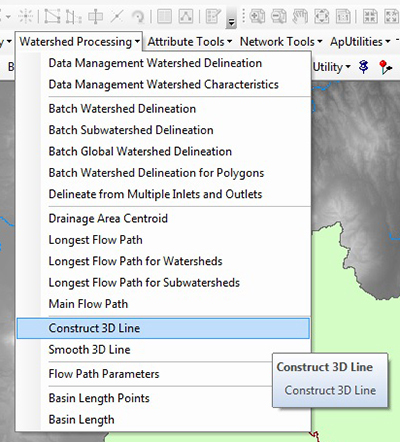
Fig. 55 Construct 3D line command.
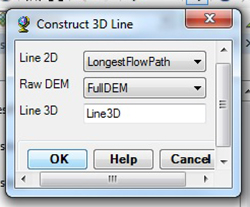
Fig. 56 Construct 3D line options.
- Clic on Flow Path Parameters > Flow Path Parameters from 3D Line, introduce the elevation and slope for 10% and 85% horizontal distance.
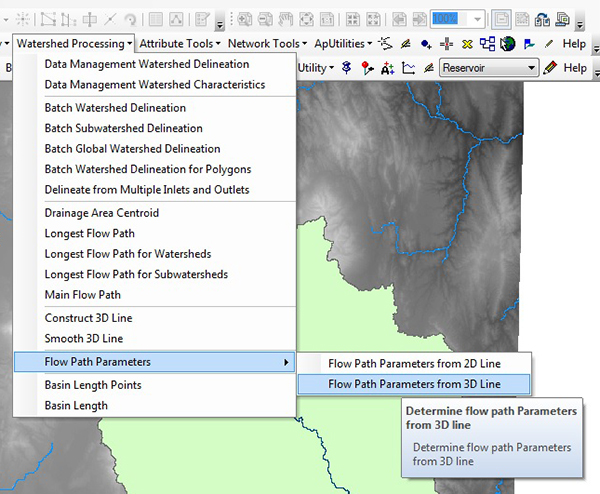
Fig. 57 Flow path parameters command.
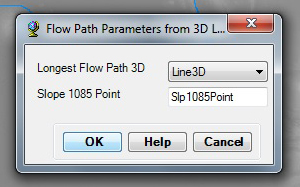
Fig. 58 Flow path parameters from 3D line options.
- Clic on Batch Watershed Delineation, delimitate the interest watershed.
- Using Charasteristics
- Clic on Basin Slope, calcute the basin slope in units %.
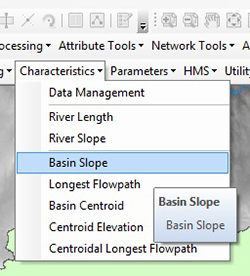
Fig. 59 Basin slope command.
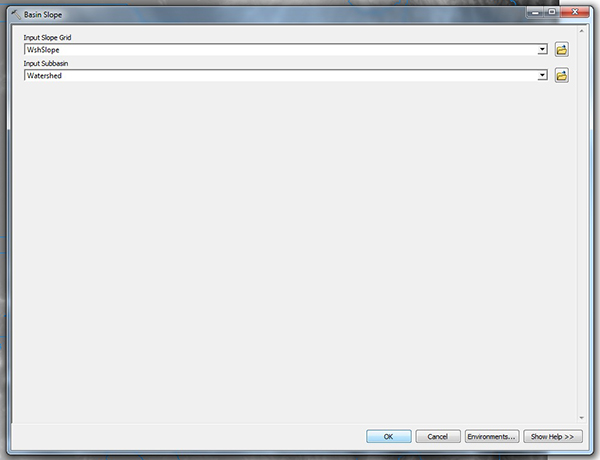
Fig. 60 Basin slope options.
- Clic on Basin Slope, calcute the basin slope in units %.
- View geomorphological data calculated
- Right clic on > Watershed shapefile > Open Attribute Table, for drainage area, perimeter and slope.

Fig. 61 Watershed geomorphological data.
- Right clic on > Line3D shapefile > Open Attribute Table, for hydraulic lenght, slope from 0 to 100%, slope from 0 to 85%, and elevations points data.

Fig. 62 Hydraulic channel length geomorphological data.
- Right clic on > Watershed shapefile > Open Attribute Table, for drainage area, perimeter and slope.